Products
SentimenTrader Trading Tools
‍
Backtest Engine
My Trading Toolkit
Correlation Analysis
Seasonality
Market Prediction
Indicators & Data API
‍
Proprietary Indicators & Charts
Market Data API
Strategies & Scanner
‍
50+ Trading Strategies
Smart Stock Scanner
Smart Option Scanner
Research Reports
‍
Research Solutions
Reports Library
Free Resources
Simple Backtest Calculator
Simple Seasonality Calculator
The Kelly Criterion Calculator
Sentiment Geo Map
Public Research Reports
Education
Sentiment Indicators
Technical Indicators
Pricing
Company
About
In the News
Testimonials
Client Success Stories
Contact
Log inLoginSign up
< BACK TO ALL REPORTS

The Russell 2000 is on the cusp of a record drought

Jason Goepfert
2023-11-01
Small-cap stocks have been mired in a long drought, with the Russell 2000's last 52-week high being almost 500 trading days ago. The index is on the cusp of a record stretch of days without a new high. Going back to 1928, Small Cap stocks have rarely gone this long without a new high.

Key points:

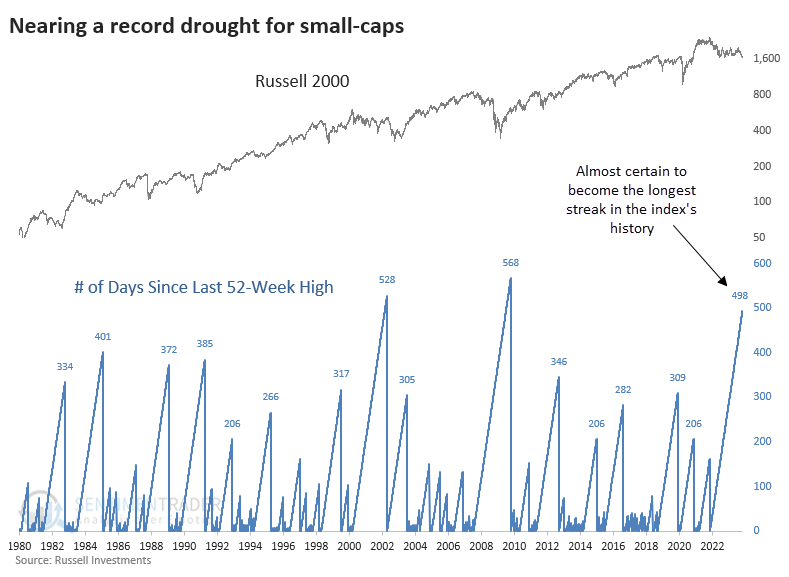
  • The Russell 2000 is on the cusp of setting a record number of sessions without a 52-week high
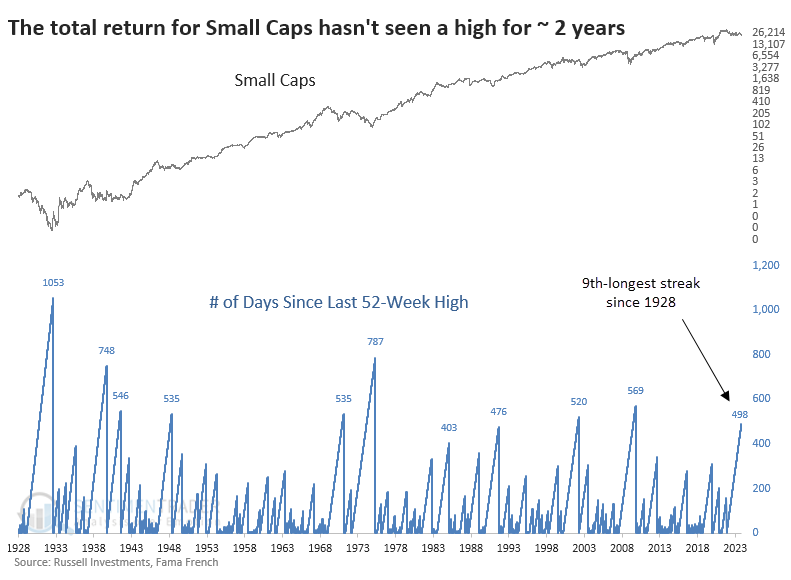
  • A longer-term proxy for Small Cap stocks is on its 9th-longest streak without a high since 1928
  • Other long stretches without a new high often preceded bounces but not lasting bottoms

Small stocks haven't set a new high for two years

Smaller stocks just can't catch a break. Several times over the summer, we looked at their weak performance relative to larger stocks, and those studies consistently showed that smaller stocks are more likely to continue to underperform. They've been following through on that tendency.

In the coming week, the Russell 2000 will have gone 500 trading days, nearly two full years, since it last closed at a 52-week high. That's the 3rd-longest streak in the index's history, and it's almost sure to set a record - it would have to rally nearly 50% in fewer than 75 days to end the streak.

We use a total return index going back to 1928 for the Small Cap factor, and that one is showing similar behavior. It is now mired in the 9th-longest streak in 95 years, with only three of them going much beyond 500 days.

Two-year streaks without a high often preceded temporary rallies

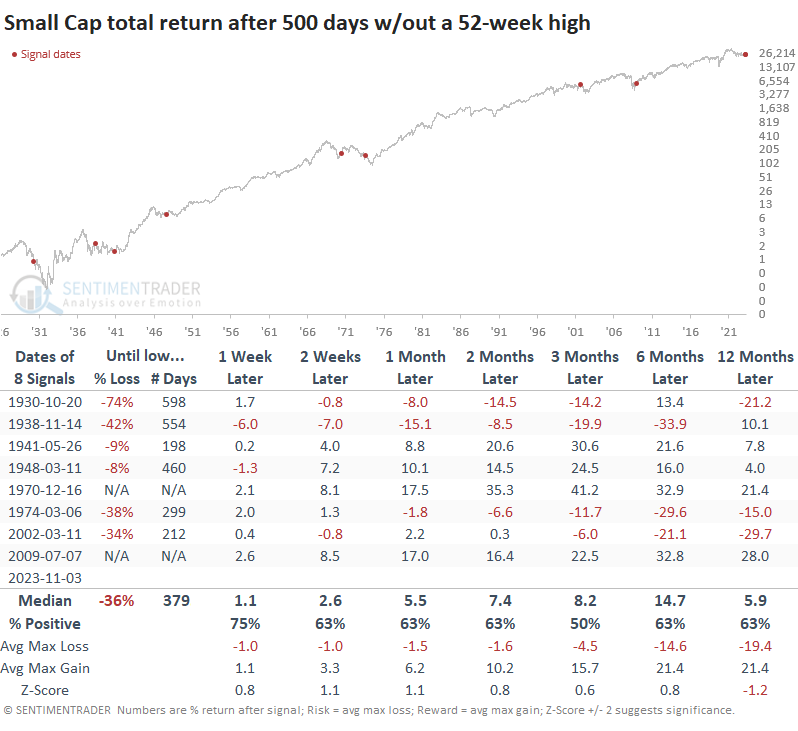
The table below shows the total return in Small Caps after 500 days without setting a 52-week high. The table shows the percentage loss and number of days until the index troughed at its lowest point for at least the next year.

For bulls, this is distressing news. Two times, Small Caps had already bottomed. But on average, the other six signals suffered a further 36% loss, and it took 379 days to reach the bottom - that's a year and a half. 

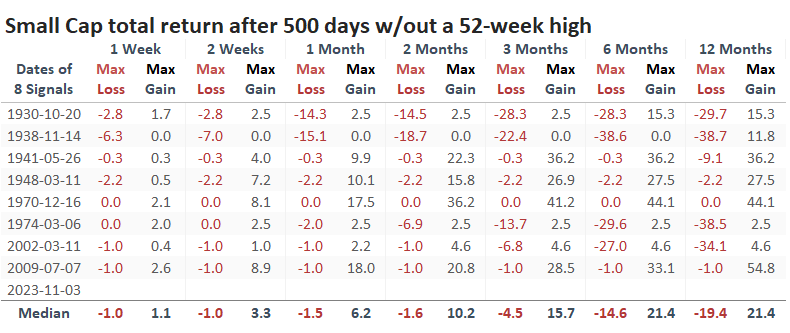
The table of maximum losses and gains across time frames shows that the two signals in the 1930s were brutal, with intense selling in the months ahead. After that, though, none of the signals showed maximum losses of more than -7% up to two months later, and four rallied more than +15% at some point. So, maybe some relief rebound tendencies.

What the research tells us...

This is a tough one. Almost everything we've discussed on the site in recent months has suggested that there wasn't a high likelihood of mean-reversion for beaten-down Small Cap stocks. And the time-to-trough table above suggests that significantly more pain could be in store before a lasting bottom. On a shorter time frame, however, most of those precedents, especially since 1940, have preceded multi-month relief rebounds. That would fit nicely with seasonality, which is strongly positive from now through January. 

PRODUCTS
SentimenTrader
Trading Tools
Indicators & Data API
‍
Strategies & Scanner
‍
Research Reports
FREE
RESOUrCES
Simple Backtest
Calculator
Simple Seasonality
Calculator
The Kelly Criterion
Calculator
Sentiment Geo Map
‍
Public Research Reports
‍
Education
Sentiment Indicators
‍
Technical Indicators
‍
Pricing
Bundle pricing
‍
FAQ
‍
Announcements
‍
COMPANY
‍
About
‍
In the News
‍
Testimonials
‍
Client Success Stories
CONTACT
‍
General Inquiries
‍
Media Inquiries
‍
Financial Professionals Inquiries
‍
© 2026 Sundial Capital Research Inc. All rights reserved.
Setsail Marketing
TermsPrivacyAffiliate Program
Risk Disclosure: The information and tools provided are for research and analytical purposes only and are not intended as investment advice. Market analysis involves uncertainty, and outcomes may differ from expectations. Users should conduct their own due diligence and consider their individual circumstances before making any financial decisions. Past performance is not necessarily indicative of future results.

Hypothetical Performance Disclosure: Hypothetical performance results have many inherent limitations, some of which are described below. No representation is being made that any account will or is likely to achieve profits or losses similar to those shown; in fact, there are frequently sharp differences between hypothetical performance results and the actual results subsequently achieved by any particular trading program. One of the limitations of hypothetical performance results is that they are generally prepared with the benefit of hindsight. In addition, hypothetical trading does not involve financial risk, and no hypothetical trading record can completely account for the impact of financial risk of actual trading. for example, the ability to withstand losses or to adhere to a particular trading program in spite of trading losses are material points which can also adversely affect actual trading results. There are numerous other factors related to the markets in general or to the implementation of any specific trading program which cannot be fully accounted for in the preparation of hypothetical performance results and all which can adversely affect trading results.

Testimonial Disclosure: Testimonials appearing on this website may not be representative of other clients or customers and is not a guarantee of future performance or success.