
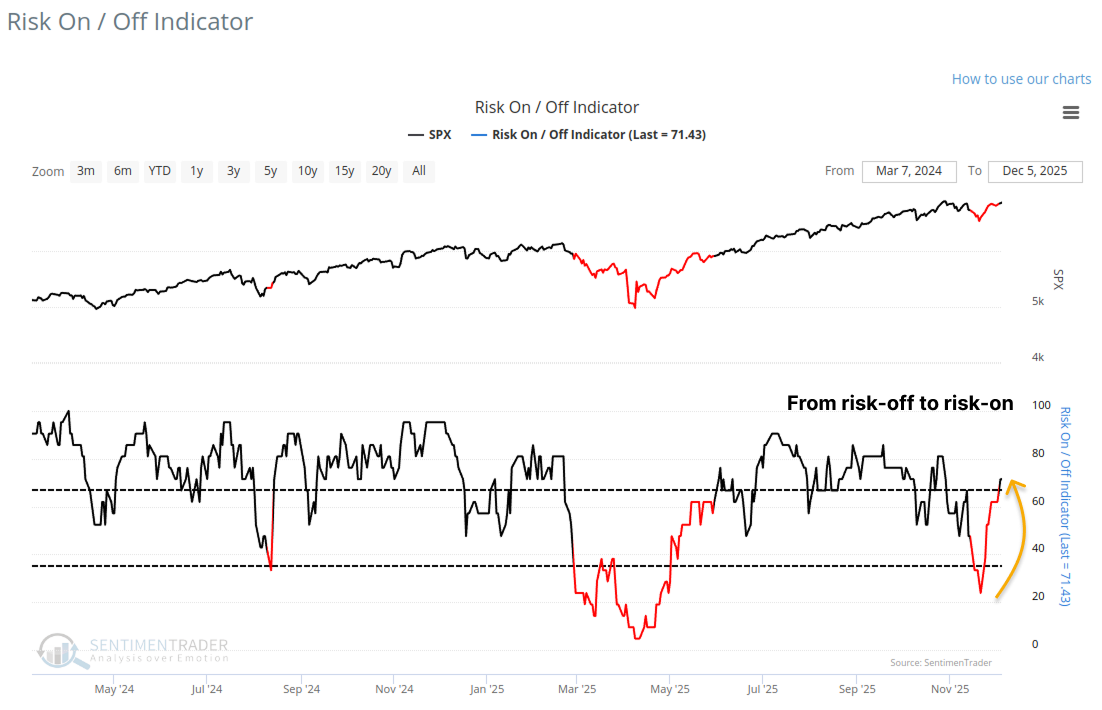
The Risk On/Off indicator shifts upward, triggering a buy signal

Key points
- The Risk On/Off Indicator, a composite of 21 sentiment and breadth measures, has shifted to a "risk-on" status.
- A swing trading system based on the indicator's 84-day range rank triggered a buy signal as it cycled from extreme pessimism to optimism.
- Historically, when this signal occurs near a multi-year high, the S&P 500 has shown outstanding returns and consistency.
Breadth and sentiment-based indicators swiftly transition to a risk-on status
Sentimentrader's team emphasizes two indispensable market analysis concepts, among many others, in our research notes: the strategic use of composite models and the identification of reversal signals.
The significance of composites lies in their ability to minimize the risk of failure, a common vulnerability associated with relying solely on a single indicator. Additionally, the utilization of reversal signals boosts the risk/reward profile of trading signals, preventing exposure to the risks of attempting to catch a falling knife.
With our proprietary Risk-On/Off Indicator, a composite encompassing 21 diverse sentiment and breadth-based measures, coupled with our upgraded backtest engine, we can harness the power of both concepts to identify advantageous trading signals.
A trading system that uses the Sentimentrader Risk On/Off Indicator to identify a shift in the composite from the bottom of its recent range toward the upper end triggered a new risk-on signal for stocks. The previous signal in June 2025 led to an 8.1% gain in the S&P 500 over the subsequent three months.
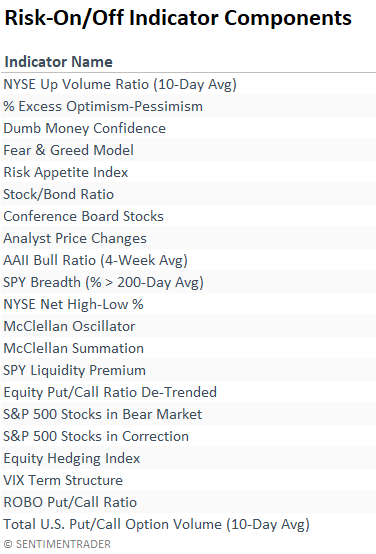
A diverse set of sentiment and breadth-based measures
The Risk-On/Off Indicator is built from a broad array of inputs to capture the true state of market psychology.
Gains were more pronounced in risk-on environments
Traders or investors might leverage the indicator in one of the following ways:
- The indicator can function as an overlay with other trading signals or strategies. Readings above 50 indicate a risk-on scenario, while below 50 suggest a risk-off situation. For example, your system would initiate a long position only when the indicator is above 50.
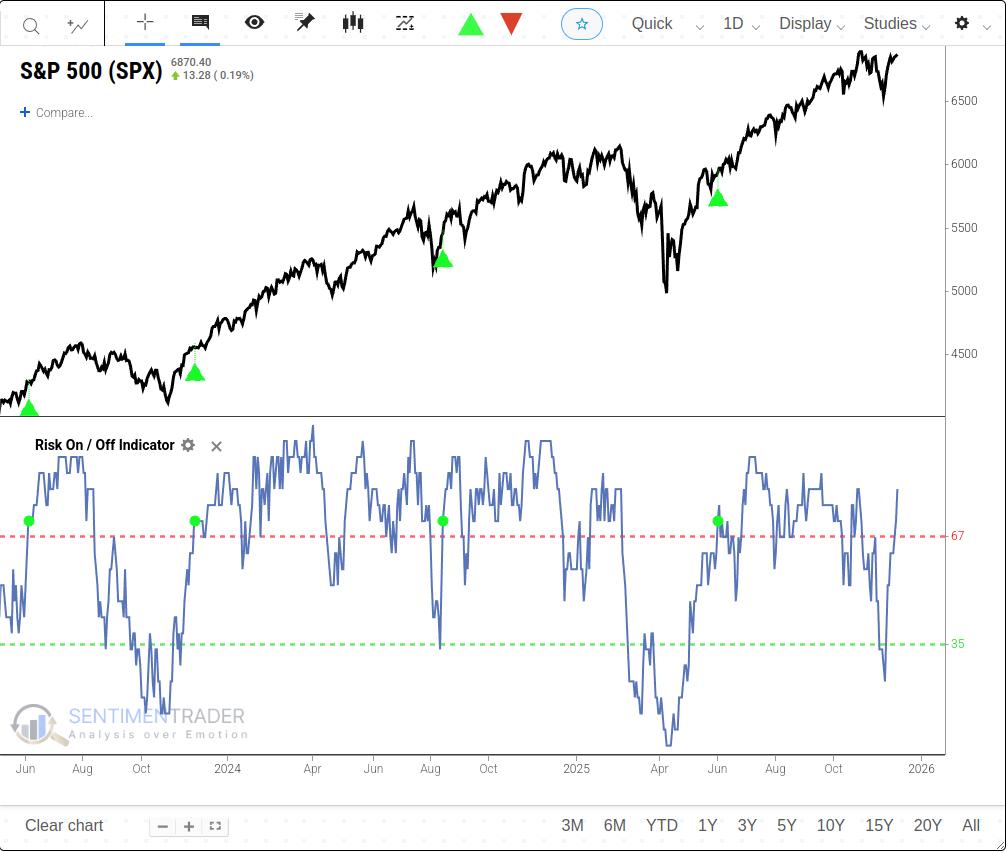
- As a standalone strategy, historical testing revealed that going long the S&P 500 when the indicator exceeds 67 and selling when it falls below 35 yielded the most favorable results.
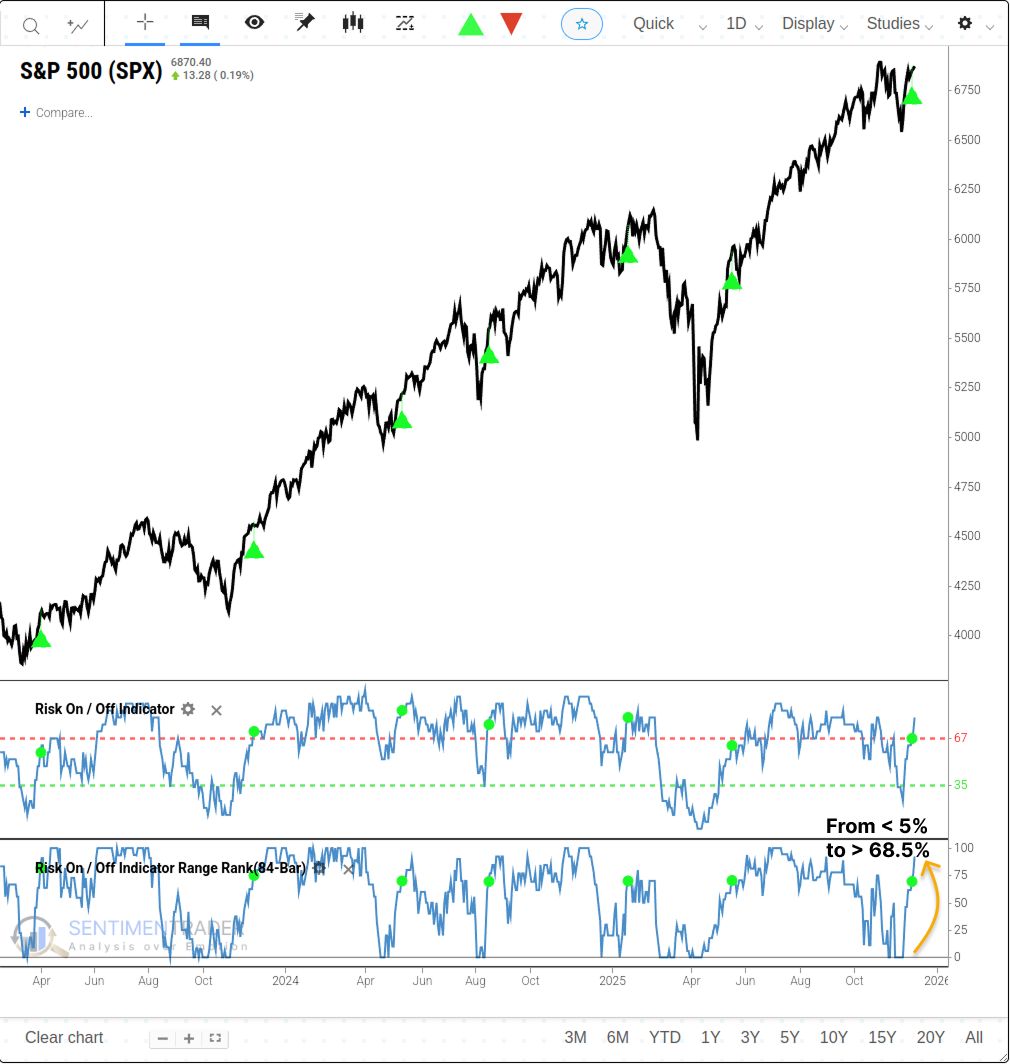
- One could employ a swing trading system by applying a range rank to the indicator. In this approach, traders would establish a long position in the S&P 500 when the rank transitions from less than 5% to greater than 68.5%.
Regarding the second approach, whenever the risk appetite indicator fluctuated from below 35% to above 67%, the outlook for the coming months was generally optimistic.
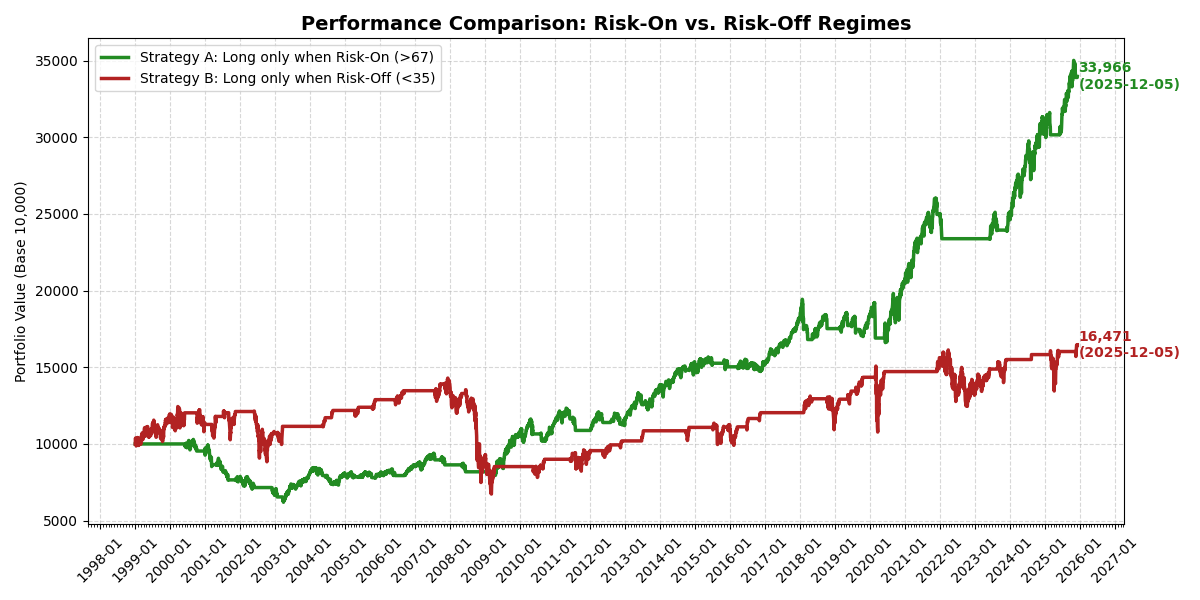
When examining a binary overlay model, such as the Risk-On/Off indicator, one way to gauge the strategy's validity is by assessing the performance of an initial capital outlay under the two market regimes. i.e., risk-on or risk-off.
A $10,000 investment in the S&P 500 grows to $33,966 when the Risk-On/Off indicator rises above 67% and stays above 35%. In contrast, if the indicator falls below 35% and remains under 67%, the investment increases to just $16,471.
The Risk On/Off indicator shifts upward, signaling improvement
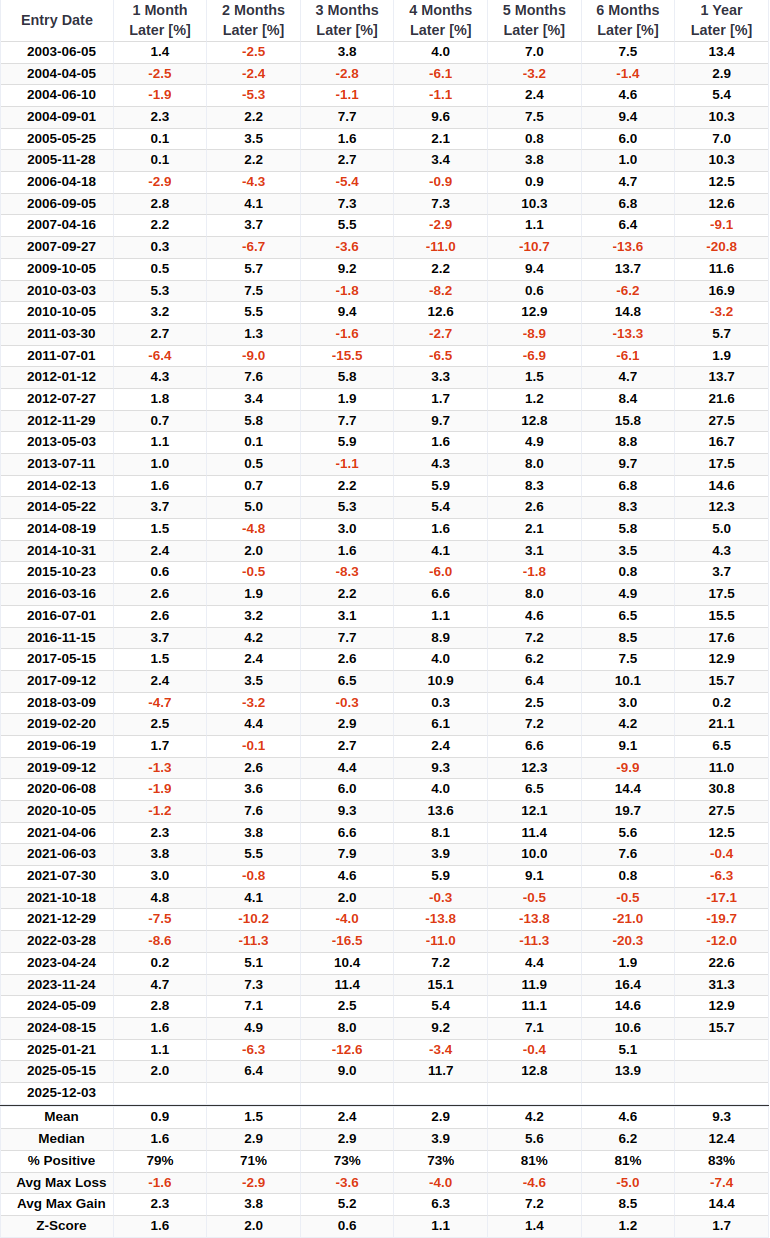
This final methodology, the swing trading approach, triggered a new buy signal when the 84-day range rank for the Risk On/Off indicator cycled from less than 5% to greater than 68.5%. The previous alert occurred in May 2025, leading to an 9% gain for the S&P 500 over the subsequent three months.
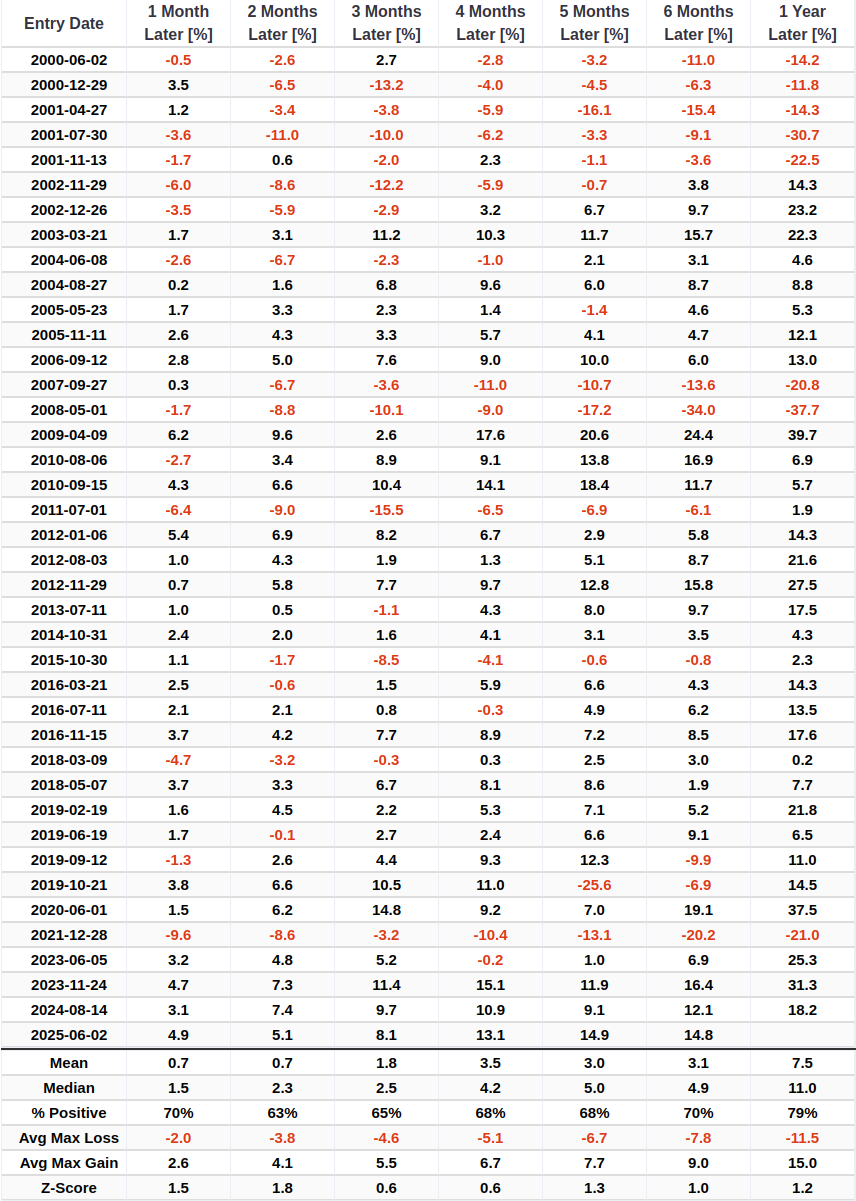
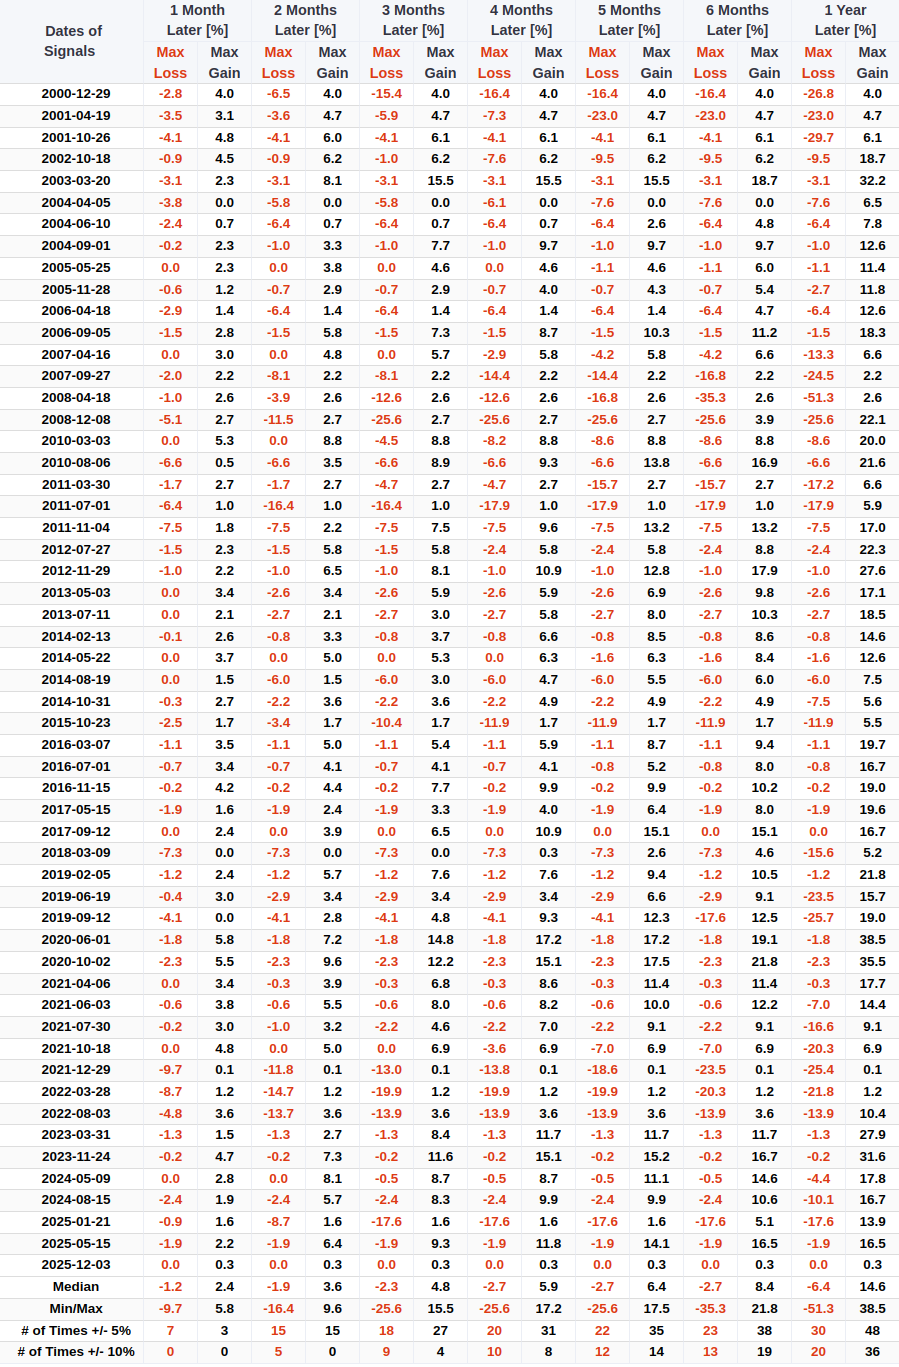
The table below lists the entry date for each signal and the returns over various timeframes.
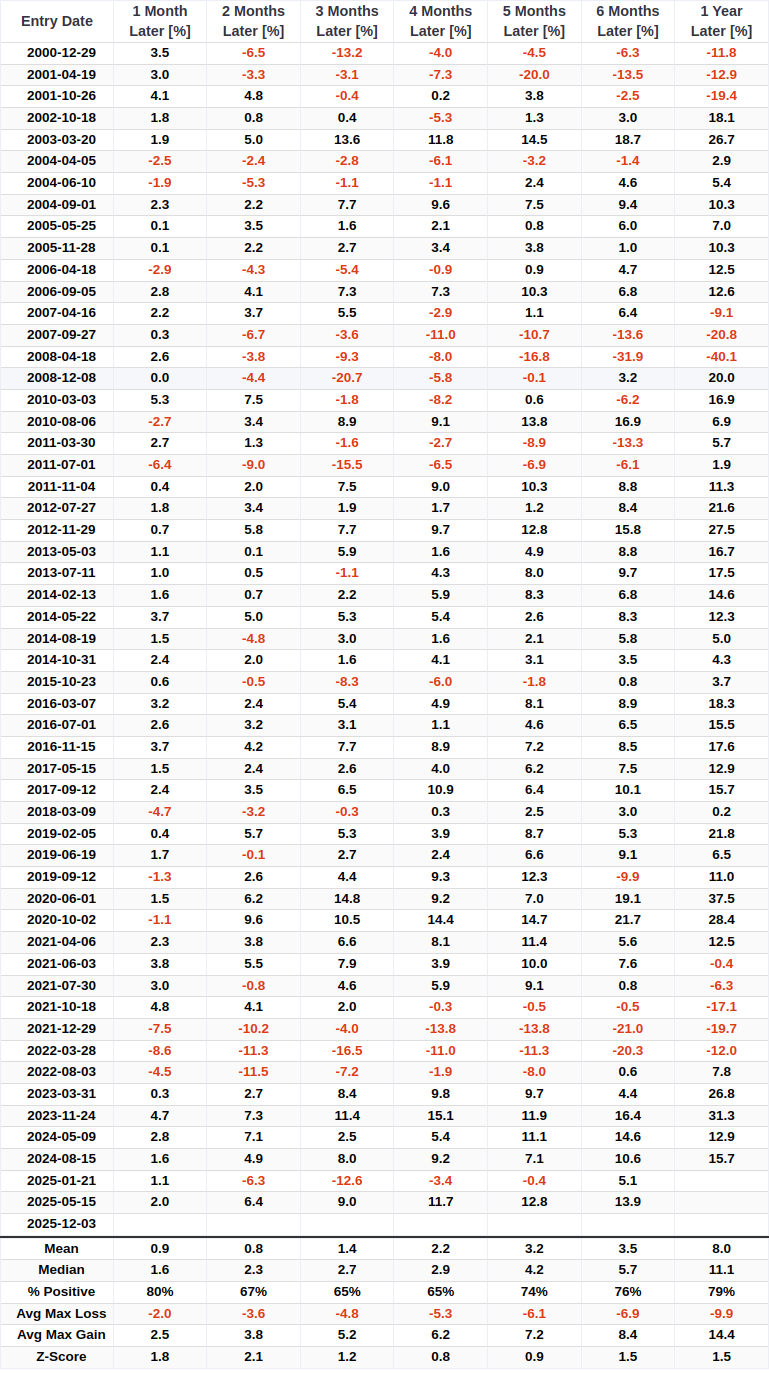
As the holding period extends to one year, the signal has generated substantial gains but has also been accompanied by significant drawdowns.
Signals near a multi-year high
Suppose I include a condition that requires the S&P 500 to close within 5% of a one-year high at the time of an alert for context similar to now. In that case, returns and win rates were still outstanding. For related backtest, click here.
How can I recreate this signal in the Backtest Engine?
Complete the following tasks in the Entry Criteria section:
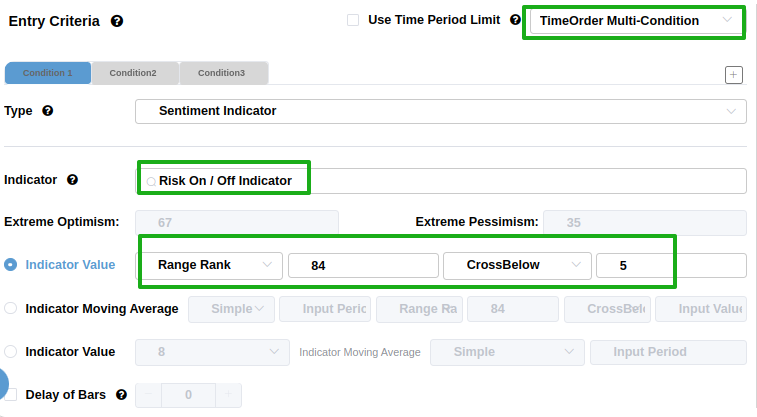
- Select TimeOrder Multi-Condition in the top right-hand corner
- In the Indicator search box, type Risk On/Off and select the indicator
- In the Indicator Value dropdown, choose Range Rank, change the lookback from 21 to 84, select CrossBelow, and enter 5
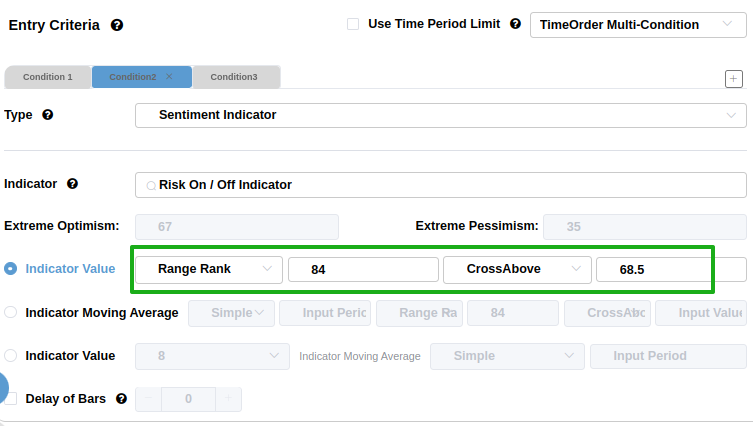
Click on the Condition2 tab and complete steps 2 and 3 from above. However, this time, select CrossAbove and enter 68.5.
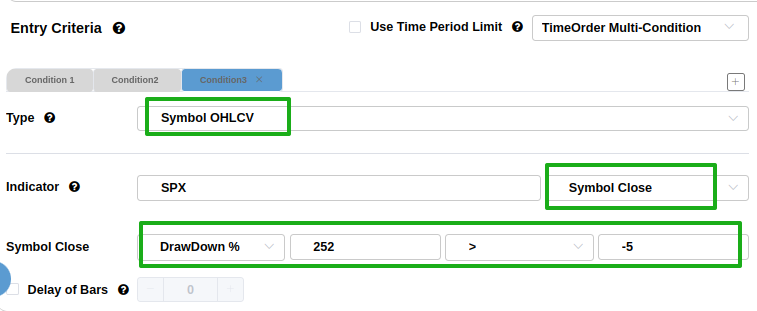
Click on the Condition3 tab
- Select Symbol OHLCV in the top
- In the Indicator box, select the SPX and Symbol Close
- In the Symbol Close dropdown, choose DrawDown%, change the lookback from 21 to 252, select >, and enter -5
Finally, click on the Run Backtest button.
What the research tells us...
The Risk On/Off Indicator is a comprehensive tool that gauges the market's emotional state by synthesizing diverse sentiment and breadth data. While it can be used as a simple overlay, a swing trading approach that identifies rapid shifts from extreme pessimism (Range Rank < 5%) to optimism (Range Rank > 68.5%) has proven particularly effective. The recent signal, occurring with the S&P 500 near its highs, suggests that the market's internal health is improving and risk appetite is returning. Historically, such setups have been followed by strong, consistent gains, reinforcing the bullish case for equities in the months ahead.