
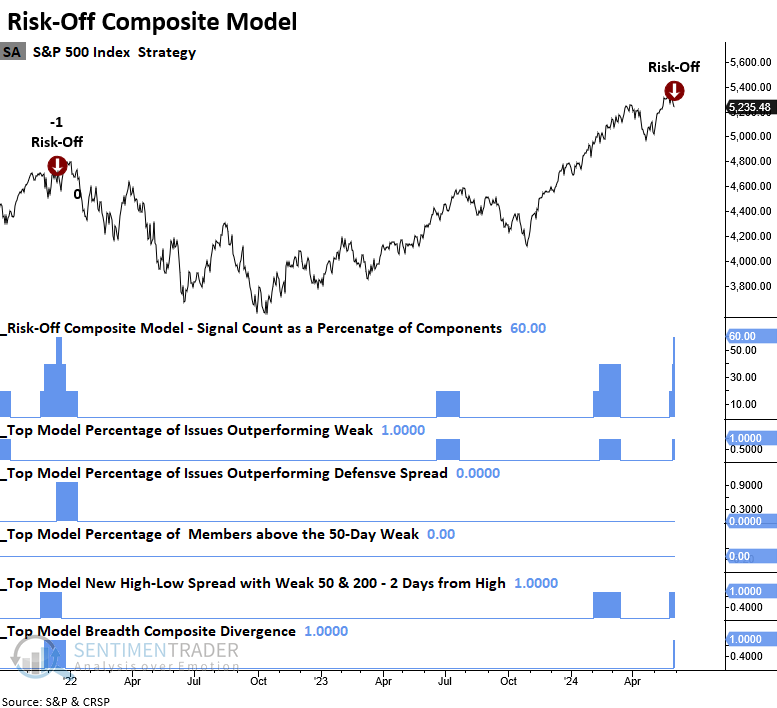
The Risk-Off Composite Model triggered a warning

Key points:
- A component in the Risk-Off Composite Model that identifies a breadth divergence issued an alert
- Similar divergences suggest the S&P 500 could struggle over the following two months
- With a third component alert, the Risk-Off Composite Model triggered a warning
A breadth divergence indicates a discrepancy between the index trend and internal strength
On Thursday, a voting member in the Risk-Off Composite Model issued a new alert. This component identifies discrepancies between the S&P 500's trend and a breadth composite, highlighting periods when internal and external trends are out of sync or diverging. The composite combines the spread between 52-week highs and lows with the percentage of issues trading above their 200-day average for S&P 500 members, reflecting long-term participation trends.
With the new component signal, the Risk-Off Composite Model triggered its first alert since December 2021. Although the S&P 500 rose to a marginal new high following that warning, investors who dismissed the risk faced harsh consequences during the severe bear market of 2022.
Should we rush to sell all our stocks in response to this warning? Absolutely not. However, it's crucial to recognize that the market environment has shifted. The period of easy gains, where all stocks rose in unison since last October, is likely over for now. This change underscores the need for effective risk management.
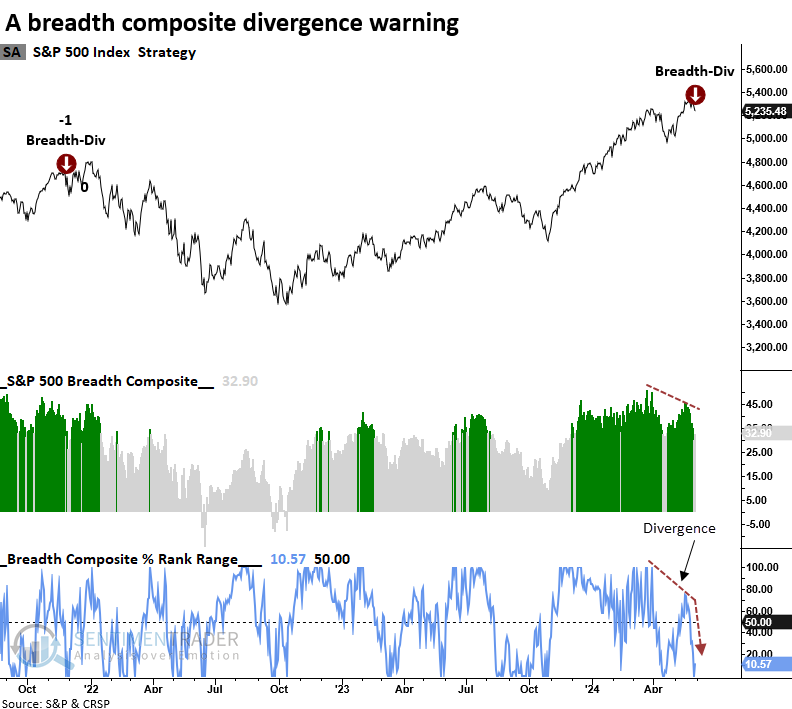
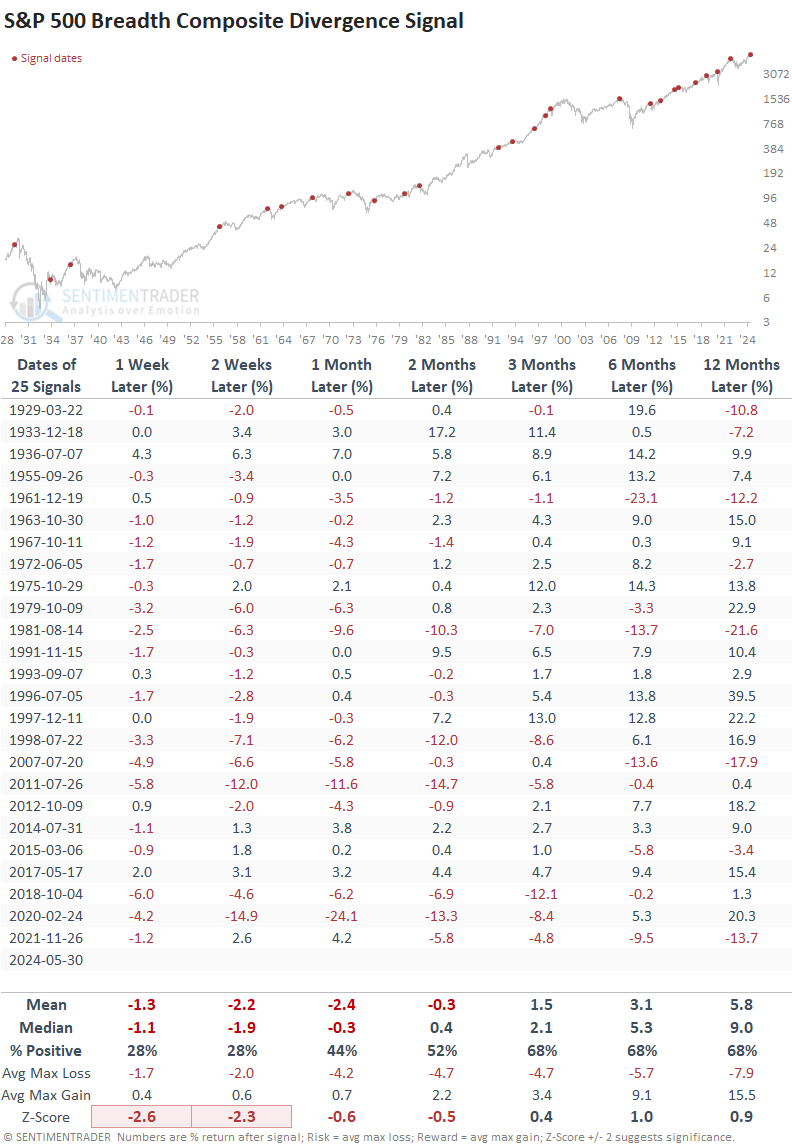
Breadth composite divergences preceded negative returns
Following a breadth composite divergence warning, the world's most benchmarked index tended to struggle over the subsequent two months. That was especially the case in the first few weeks, with the S&P 500 declining 72% of the time in both the one- and two-week periods. Over the first three months, the median maximum loss exceeded the maximum gain in each time frame.
Once the corrective phase ended, the S&P 500 rallied over longer horizons, displaying returns and win rates that exceeded or matched random results over the study period.
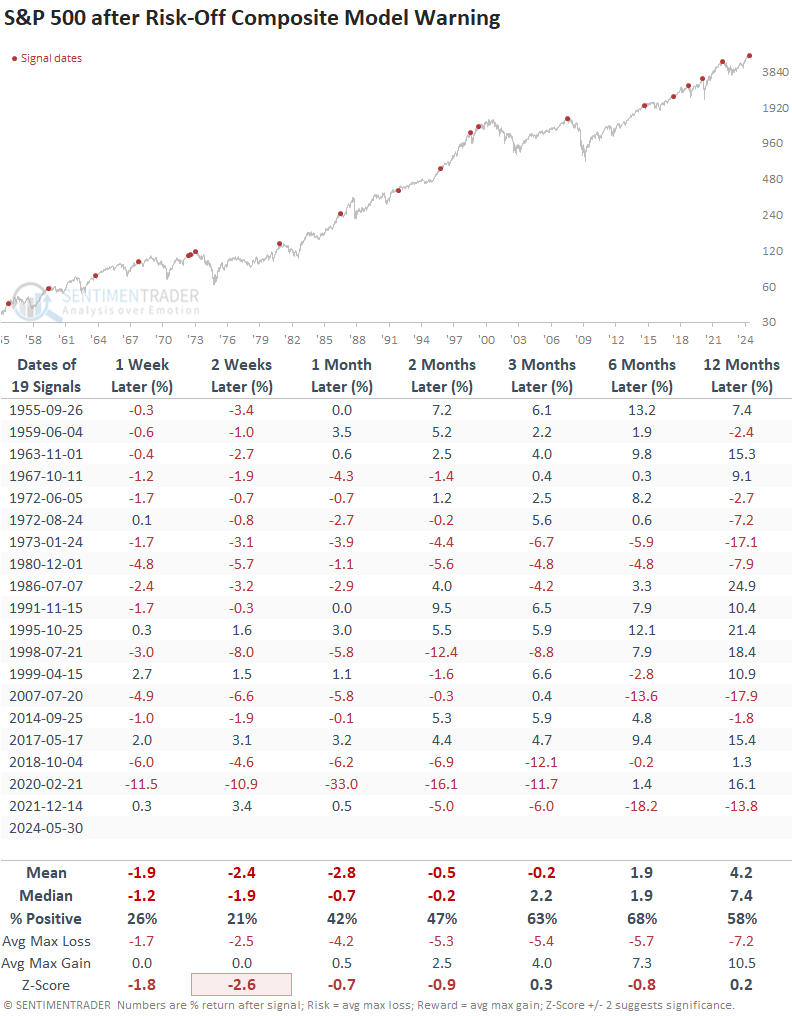
The weight of the evidence tilts to the bearish side
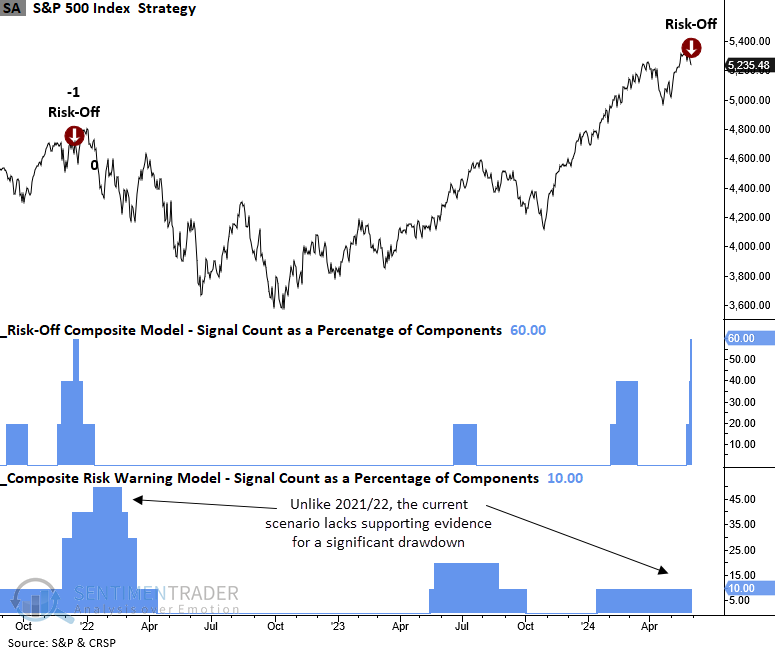
The Risk-Off Composite Model signal count increased to 60%, triggering the 20th warning since 1955.
Whenever the Risk-Off Composite Model triggered a warning, the S&P 500 struggled over the subsequent two months, with the greatest risk of a selloff occurring in the first two weeks. Over that horizon, the world's most benchmarked index declined 79% of the time. Like the divergence model, the median maximum loss exceeded the maximum gain in each horizon throughout the initial three months.
The case against a significant correction
Estimating the magnitude of a market correction is challenging. It can be subtle over time due to sector rotation or more profound via a downside price adjustment.
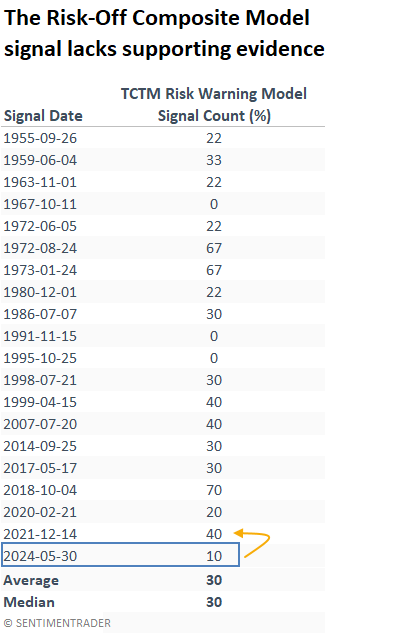
With a TCTM Composite Risk Warning Model signal count of 10%, the current Risk-Off Composite Model alert lacks the supporting evidence observed during the previous warning in December 2021. In contrast, the big-picture RWM exhibited a substantially higher signal count of 40% during that period, reaching 50% in January 2022, which triggered a signal. So, the case for a significant drawdown seems unlikely.
What the research tells us...
A trading model that detects a divergence between the S&P 500's price trend and a breadth composite generated an alert, contributing to a broad warning for the Risk-Off Composite Model. Similar precedents for both models have often preceded a multi-month period of turbulence for the S&P 500, with most of the risk in the initial weeks. While it's impossible to forecast the magnitude or duration of market corrections, the TCTM Composite Risk Warning Model signal count suggests a significant drawdown is unlikely. As risks escalate, investors must remain vigilant in their approach to risk management.