
The Risk-Off Composite Model triggered a new alert

Key points:
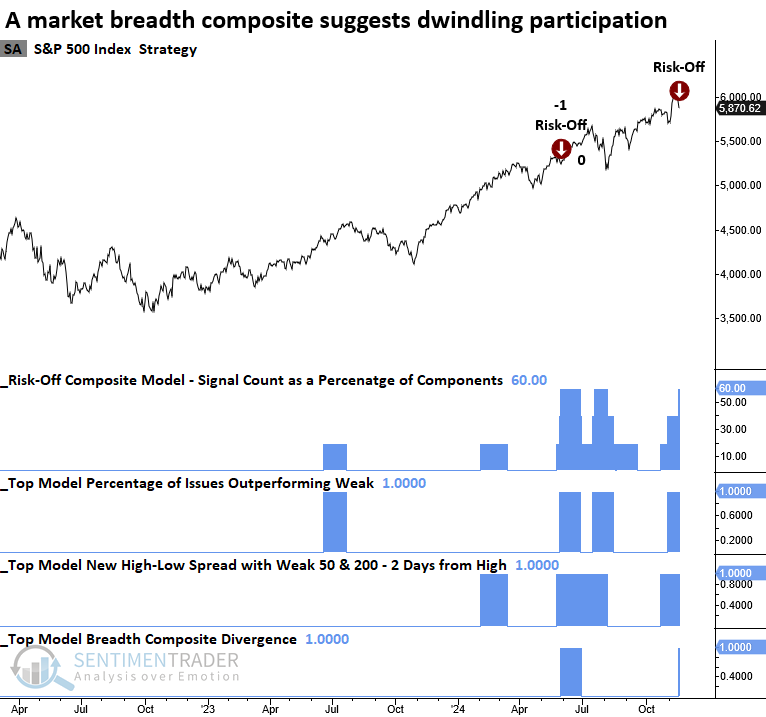
- The Risk-Off Composite Model triggered a new warning, indicating that participation is dwindling
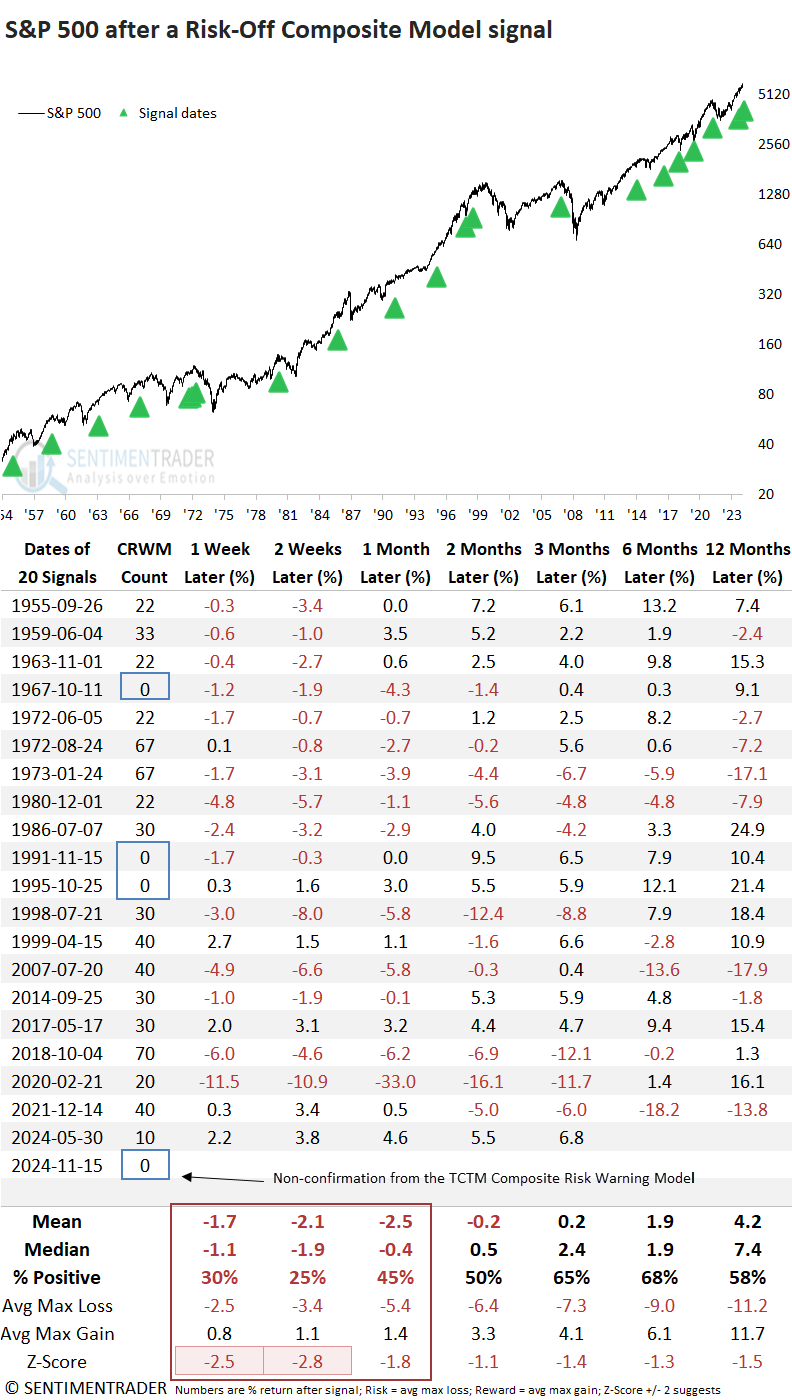
- Similar alerts produced an unfavorable outlook for the S&P 500 over the subsequent month
- The TCTM Composite Risk Warning Model signal count persists at zero
Business cycle factors are starting to weigh on stock market participation
The Risk-Off Composite Model, which utilizes market breadth indicators to identify dwindling stock participation, triggered a new alert. If you recall, the model generated a signal in May, and the S&P 500 continued to march higher, ignoring the participation problem. As discussed in that report, the TCTM Composite Risk Warning Model displayed only one component with a warning, suggesting from a big-picture perspective, breadth remained constructive.
Although the Risk-Off Composite Model maintains a solid track record of identifying potential trouble, all indicators are susceptible to whipsaw signals. These often arise during sector rotation phases, when macroeconomic forces such as rising interest rates or a robust dollar pressure certain groups, leading to declining participation.
Comparable market breadth conditions preceded negative returns
Following the activation of risk-off composite model alerts, the S&P 500 endured a challenging period in the months ahead. The first two weeks were particularly turbulent, as performance displayed statistically significant negative returns compared to random expectations.
As indicated in the second column, the TCTM Composite Risk Warning Model has no active signals, suggesting that long-term measures of market participation do not confirm the shorter duration indicators found in the Risk-Off Composite Model. Consequently, I would not expect a significant correction.
What's driving the deterioration in market breadth?
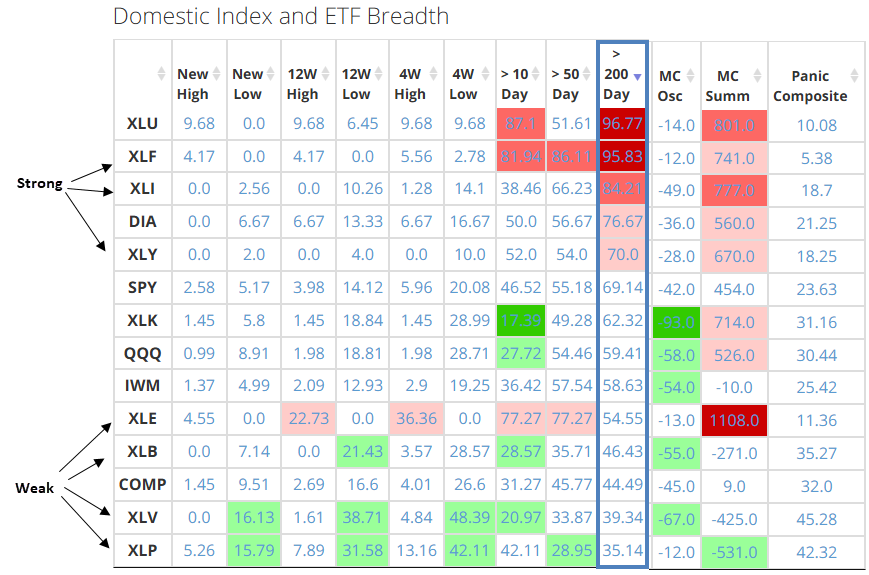
In my research report, "Defensive and commodity-oriented sectors drive the expansion in 4-week lows," I highlighted how defensive and commodity sectors overwhelmingly contributed to an expansion in 4-week lows, whereas cyclical groups maintained a constructive stance. As shown in the table below, this bifurcated breadth backdrop persists.
Sorting our website's market breadth table by the percentage of stocks above their 200-day average points to resilience in cyclical sectors but challenges for groups impacted by higher interest rates, commodity prices, or potential healthcare reforms from a new administration.
As long as cyclical sector stocks continue to show constructive participation, the Risk-Off Composite Model alert may again result in sector rotation, as it did in May 2024, rather than signaling a systemic problem that typically leads to a significant correction.
Why did the last signal result in a whipsaw?
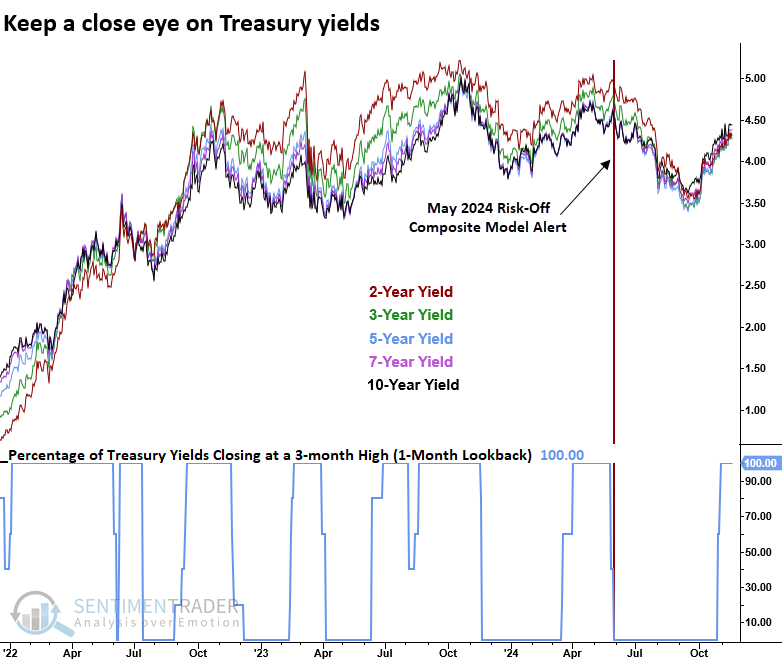
A crucial factor behind the whipsaw signal following the May 2024 Risk-Off Composite Model alert was the trajectory of bonds. Treasury yields peaked almost simultaneously with the signal and declined for over three months, providing a tailwind for equity markets. Will this time be different?
What the research tells us...
Stock market participation has begun to falter following the election rally, with several groups facing renewed pressure from rising interest rates and potential disruptions tied to healthcare reforms under the new administration. The Risk-Off Composite Model has now issued its second alert of the year, driven by this participation problem primarily outside the key cyclical sectors. Similar signals have preceded challenging periods for the S&P 500, with weakness particularly pronounced in the initial weeks. However, with the TCTM Composite Risk Warning Model signal count currently residing at zero, an imminent threat of a significant correction seems unlikely. Traders should monitor Treasury yields closely, as they may offer critical insights into the future trajectory of equities.