Products
SentimenTrader Trading Tools
‍
Backtest Engine
My Trading Toolkit
Correlation Analysis
Seasonality
Market Prediction
Indicators & Data API
‍
Proprietary Indicators & Charts
Market Data API
Strategies & Scanner
‍
50+ Trading Strategies
Smart Stock Scanner
Smart Option Scanner
Research Reports
‍
Research Solutions
Reports Library
Free Resources
Simple Backtest Calculator
Simple Seasonality Calculator
The Kelly Criterion Calculator
Sentiment Geo Map
Public Research Reports
Education
Sentiment Indicators
Technical Indicators
Pricing
Company
About
In the News
Testimonials
Client Success Stories
Contact
Log inLoginSign up
< BACK TO ALL REPORTS

The reversal in the Dollar Index continues

Dean Christians
2022-12-01
The Dollar Index (DXY) continues to retreat from a 20-year high, declining by almost 5% in November. The month-over-month plunge represents the most significant contraction in the DXY since 2010. After similar drops, stocks and commodities struggled in the near term but recovered over long-term time frames.

Key points:

  • The Dollar Index (DXY) declined by more than 4.5% over one month
  • After similar contractions, the DXY continued lower over the next six months
  • Stocks and commodities tend to struggle in the near term but benefit 6-12 months later
  • Long-term bond yields are likely to decline over the next year

The reversal in the Dollar Index continues

The Dollar Index (DXY) is down over 1% today, adding to the swift reversal from a 20-year high. Today's adverse price action comes after the DXY declined by almost 5% in November, representing the most significant monthly decline since 2010.

Could the plunge in the Dollar Index foreshadow a potential trend change or a recession? Unfortunately, we will only know in hindsight. However, we can use history as a guide to provide us with some potential outcomes for the DXY and other asset classes on a go-forward basis.

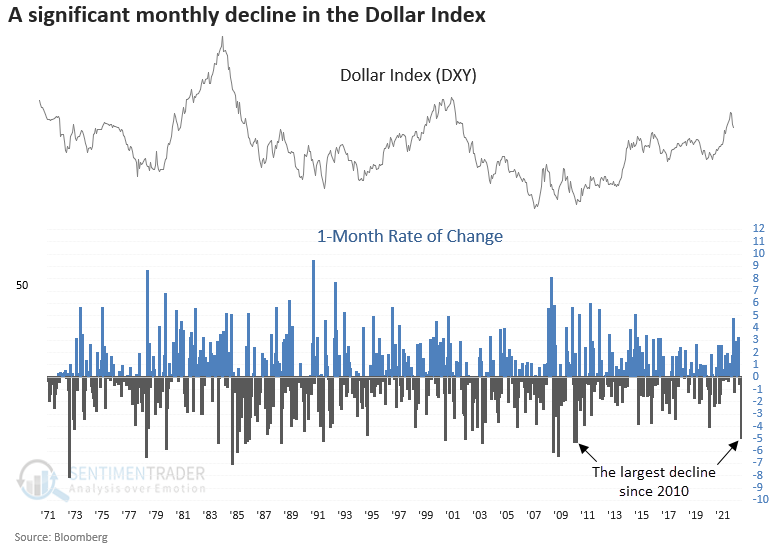
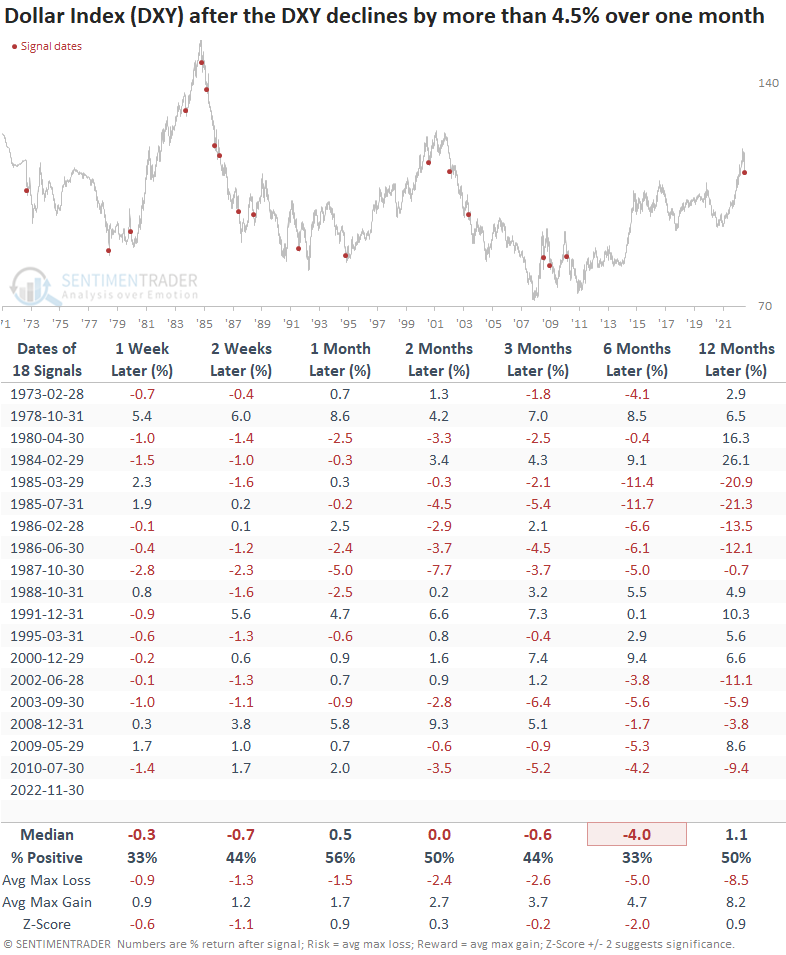
Similar monthly declines preceded negative returns for the Dollar Index

The Dollar Index tends to decline after it plunges by 4.5% in a month, especially six months later. The signal shows a negative return at some point in the first six months in 17 of 18 cases.

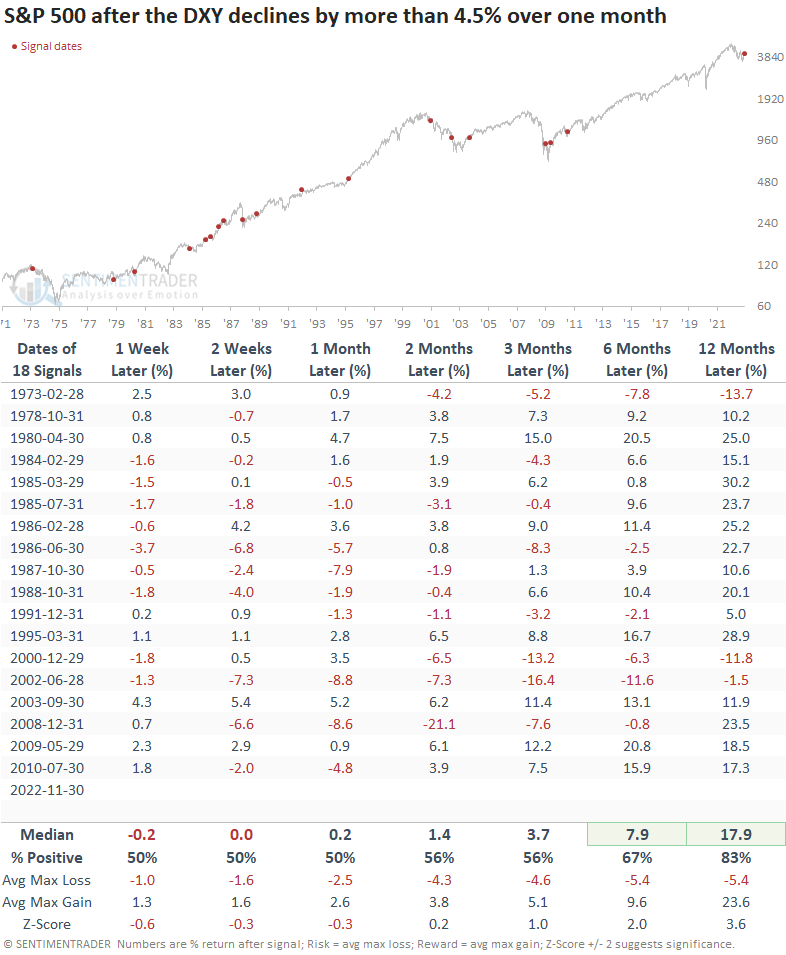
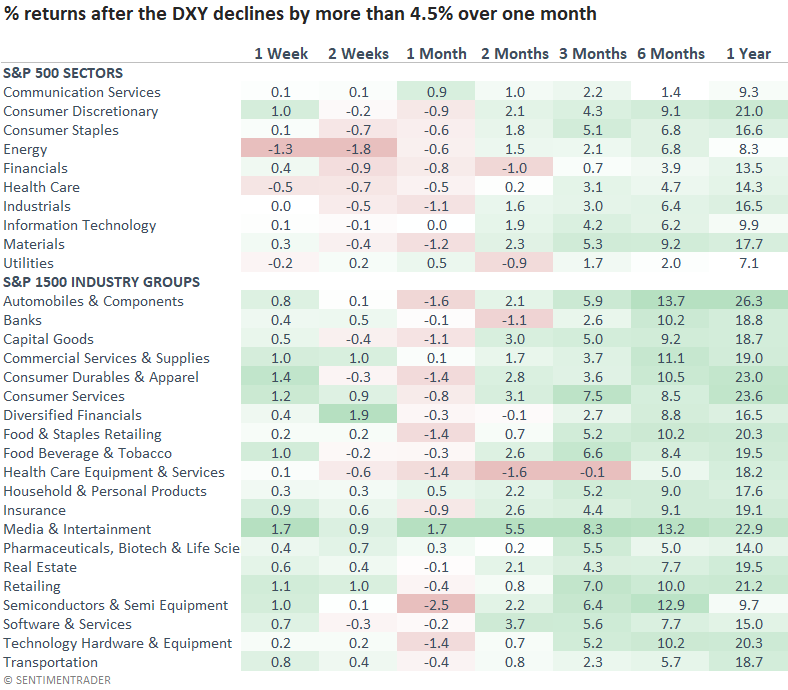
Stocks tend to benefit from a weaker dollar over the long-term

The S&P 500 was slightly negative to flat over the first month. Still, it showed a tendency to recover and post solid returns in six- and 12-month periods. The significant drawdowns a year later all occurred during long-duration bear markets.

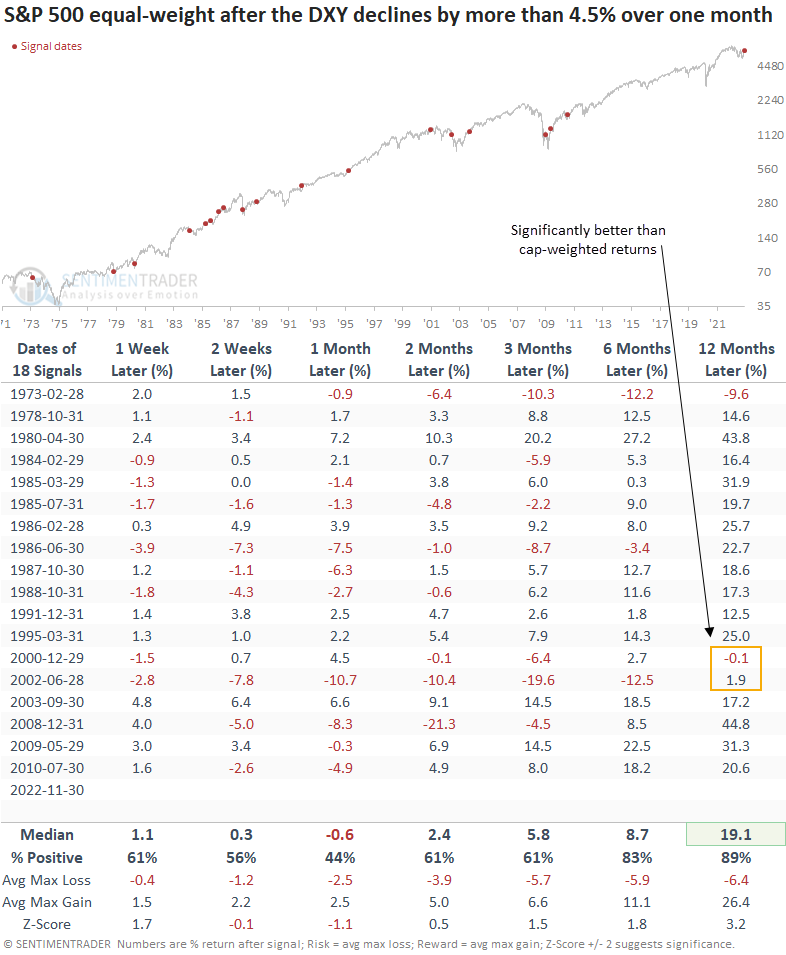
The S&P 500 equal-weighted index shows a similar return profile to the cap-weighted version. One notable difference is the performance in the 2000-02 bear market. The average stock performed much better as the cap-weighted index was impacted by Technology. Sound familiar. 

Interestingly, large-cap sectors did not benefit as much from the weaker dollar as the all-cap industry groups. i.e., the lower dollar did not benefit large companies with more overseas exposure. I would also note that resourced-based sectors like energy underperformed in the near term.

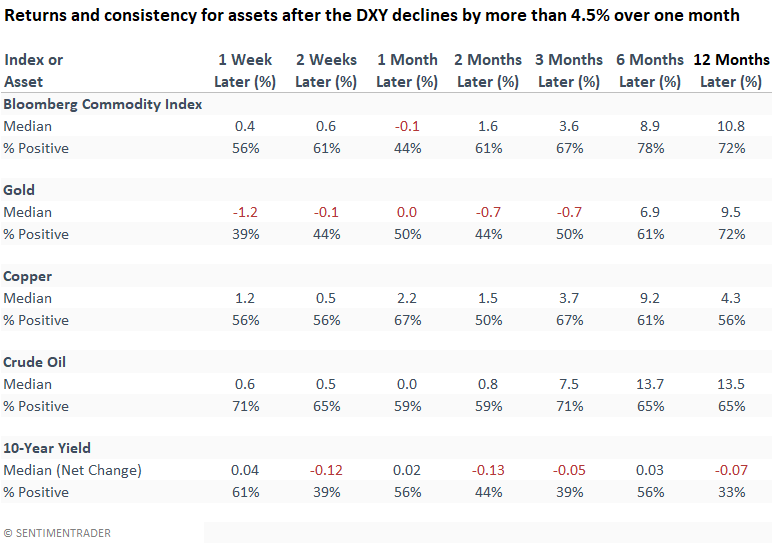
Commodities tend to benefit, and long-term yields could decline

Commodities tend to show an upward bias, with solid results in the six-to-12-month time frames. Interestingly, gold struggles in the first three months. With gold up 8% in November and 3% more today, that could be the case again.

The 10-year yield should decline. However, we must remember that most signals occurred during a secular decline in yields.

What the research tells us...

The Dollar Index remains under pressure after reversing from a 20-year high. More often than not, a falling dollar tends to be bullish for stocks and commodities over the long term. From a big-picture perspective, one has to wonder what, if any, message we should take away from the relentless decline in the DXY. Risk assets will struggle if it's signaling that the Fed made a policy mistake and a recession is coming. 

PRODUCTS
SentimenTrader
Trading Tools
Indicators & Data API
‍
Strategies & Scanner
‍
Research Reports
FREE
RESOUrCES
Simple Backtest
Calculator
Simple Seasonality
Calculator
The Kelly Criterion
Calculator
Sentiment Geo Map
‍
Public Research Reports
‍
Education
Sentiment Indicators
‍
Technical Indicators
‍
Pricing
Bundle pricing
‍
FAQ
‍
Announcements
‍
COMPANY
‍
About
‍
In the News
‍
Testimonials
‍
Client Success Stories
CONTACT
‍
General Inquiries
‍
Media Inquiries
‍
Financial Professionals Inquiries
‍
© 2026 Sundial Capital Research Inc. All rights reserved.
Setsail Marketing
TermsPrivacyAffiliate Program
Risk Disclosure: The information and tools provided are for research and analytical purposes only and are not intended as investment advice. Market analysis involves uncertainty, and outcomes may differ from expectations. Users should conduct their own due diligence and consider their individual circumstances before making any financial decisions. Past performance is not necessarily indicative of future results.

Hypothetical Performance Disclosure: Hypothetical performance results have many inherent limitations, some of which are described below. No representation is being made that any account will or is likely to achieve profits or losses similar to those shown; in fact, there are frequently sharp differences between hypothetical performance results and the actual results subsequently achieved by any particular trading program. One of the limitations of hypothetical performance results is that they are generally prepared with the benefit of hindsight. In addition, hypothetical trading does not involve financial risk, and no hypothetical trading record can completely account for the impact of financial risk of actual trading. for example, the ability to withstand losses or to adhere to a particular trading program in spite of trading losses are material points which can also adversely affect actual trading results. There are numerous other factors related to the markets in general or to the implementation of any specific trading program which cannot be fully accounted for in the preparation of hypothetical performance results and all which can adversely affect trading results.

Testimonial Disclosure: Testimonials appearing on this website may not be representative of other clients or customers and is not a guarantee of future performance or success.