Products
SentimenTrader Trading Tools
‍
Backtest Engine
My Trading Toolkit
Correlation Analysis
Seasonality
Market Prediction
Indicators & Data API
‍
Proprietary Indicators & Charts
Market Data API
Strategies & Scanner
‍
50+ Trading Strategies
Smart Stock Scanner
Smart Option Scanner
Research Reports
‍
Research Solutions
Reports Library
Free Resources
Simple Backtest Calculator
Simple Seasonality Calculator
The Kelly Criterion Calculator
Sentiment Geo Map
Public Research Reports
Education
Sentiment Indicators
Technical Indicators
Pricing
Company
About
In the News
Testimonials
Client Success Stories
Contact
Log inLoginSign up
< BACK TO ALL REPORTS

The rest of 2025 - the good news

Jay Kaeppel
2025-04-28
The same 20-year cycle that correctly flagged March 2025 as an "Ugly" month looks decidedly more favorable for the remainder of 2025. Details herein.

Key points

  • My 20-year cycle flagged March 2025 as a potential "Ugly" month - sadly, this turned out to be correct
  • The same cycle is now flagging certain months during the rest of 2025 and into 2026 as "favorable"
  • We examine the history of these favorable months below

The overview

My 20-year cycle numbers each month of the decade as #1 (January of Year "0") through #240 (December of Year "19"). A given month can be labeled "Favorable", "Unfavorable" (I prefer to refer to them as "Ugly"), or "Neutral".

Next up in the category of "Favorable" months are months #65, 67, and 69 through #73. This equates to:

  • May 2025
  • July 2025
  • September, October, November, December 2025
  • January 2026

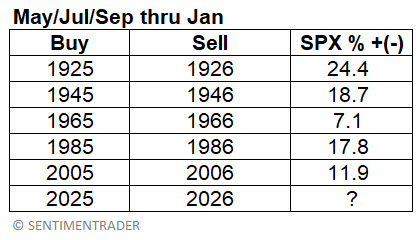
To be clear, this would involve buying an S&P 500 index fund at the end of April, selling it at the end of May, repurchasing it at the end of June, selling again at the end of July, then buying once more at the end of August and - finally - exiting at the end of January 2026.

From 1920 forward, we will use price data for the S&P 500 Index for testing purposes. So, to be clear, the "strategy" (if you can call it that) started in 1925 and bought and held the S&P 500 Index during May, July, September, October, November, December of 1925, and January 1926. It does the same thing every successive twenty years (1945-46, 1965-66, etc.).

The next period in this cycle begins at the end of April 2025. Does it matter?

A look back at the cycle history

The table below displays the hypothetical returns generated every 20 years if the S&P 500 is held only during the abovementioned months.

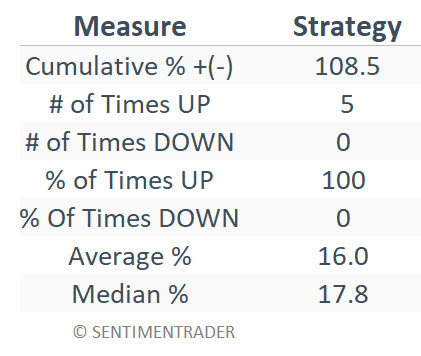
The table below summarizes stock market performance during these favorable periods.

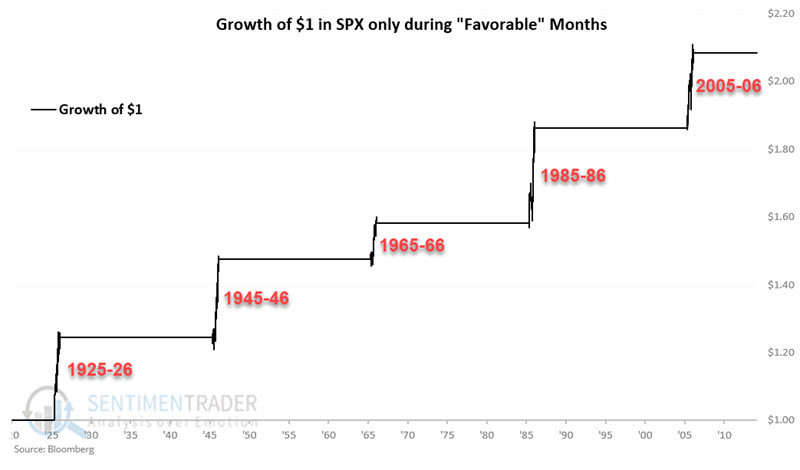
The chart below displays the hypothetical growth of $1 invested in stocks only during the abovementioned periods.

What the research tells us…

Will the period from the end of April 2025 through January 2026 resemble the results in the chart above? Or is this cycle destined to underperform or show a loss this time around? We cannot predict. 

I recently posted a less-than-favorable note regarding stock market performance for the remainder of 2025. Now this piece seems to promise "sure thing" gains (at least during May, July, and September through January 2026). So, what's an investor/trader to do? "Hope for the best, prepare for the worst" sounds like reasonable advice. Above all else, pay close attention to trends and give the favorable case the benefit of the doubt if price action is sensible during the upcoming "favorable" months.

PRODUCTS
SentimenTrader
Trading Tools
Indicators & Data API
‍
Strategies & Scanner
‍
Research Reports
FREE
RESOUrCES
Simple Backtest
Calculator
Simple Seasonality
Calculator
The Kelly Criterion
Calculator
Sentiment Geo Map
‍
Public Research Reports
‍
Education
Sentiment Indicators
‍
Technical Indicators
‍
Pricing
Bundle pricing
‍
FAQ
‍
Announcements
‍
COMPANY
‍
About
‍
In the News
‍
Testimonials
‍
Client Success Stories
CONTACT
‍
General Inquiries
‍
Media Inquiries
‍
Financial Professionals Inquiries
‍
© 2026 Sundial Capital Research Inc. All rights reserved.
Setsail Marketing
TermsPrivacyAffiliate Program
Risk Disclosure: The information and tools provided are for research and analytical purposes only and are not intended as investment advice. Market analysis involves uncertainty, and outcomes may differ from expectations. Users should conduct their own due diligence and consider their individual circumstances before making any financial decisions. Past performance is not necessarily indicative of future results.

Hypothetical Performance Disclosure: Hypothetical performance results have many inherent limitations, some of which are described below. No representation is being made that any account will or is likely to achieve profits or losses similar to those shown; in fact, there are frequently sharp differences between hypothetical performance results and the actual results subsequently achieved by any particular trading program. One of the limitations of hypothetical performance results is that they are generally prepared with the benefit of hindsight. In addition, hypothetical trading does not involve financial risk, and no hypothetical trading record can completely account for the impact of financial risk of actual trading. for example, the ability to withstand losses or to adhere to a particular trading program in spite of trading losses are material points which can also adversely affect actual trading results. There are numerous other factors related to the markets in general or to the implementation of any specific trading program which cannot be fully accounted for in the preparation of hypothetical performance results and all which can adversely affect trading results.

Testimonial Disclosure: Testimonials appearing on this website may not be representative of other clients or customers and is not a guarantee of future performance or success.