
The recent thrust is favorable for small-caps

Key points
- Small caps have underperformed large caps for several years
- A recent thrust in the Russell 2000 Index suggests good potential for more upside for small-caps
- Whether there will be a sea change in small-caps relative to large-caps remains to be seen
The recent thrust in small caps could signal even better days ahead
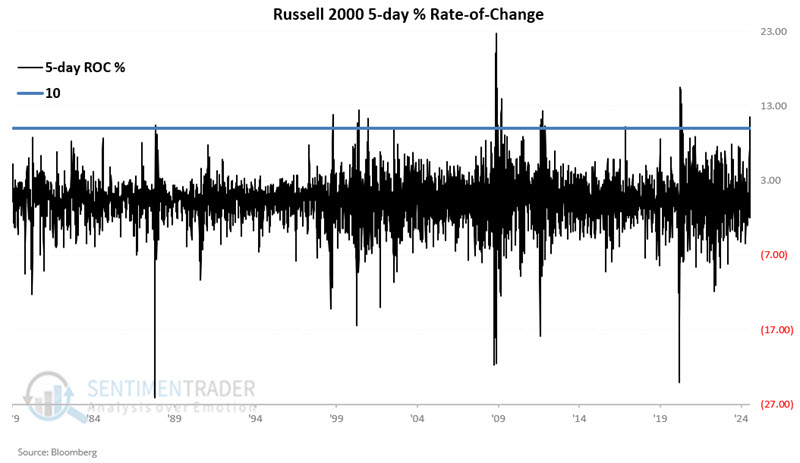
The chart below displays the 5-day percentage rate-of-change for the Russell 2000 (ticker RUT) since 1979. The blue line represents the +10% level. At the far right, we see that on 2024-07-16, the RUT 5-day change crossed above +10%.
Let's examine RUT performance following previous readings of +10% or more to see if there may be any implications for small-cap stocks going forward. The table below displays RUT performance following each +10% reading since 1979, including overlapping signals.
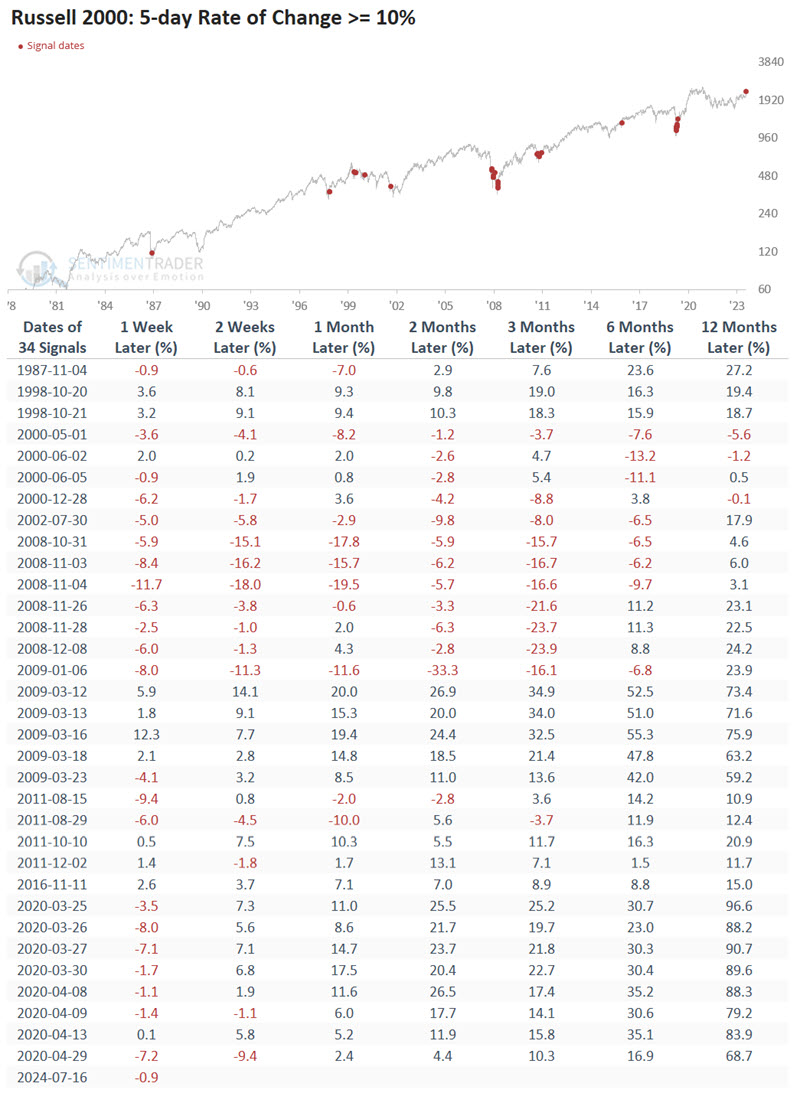
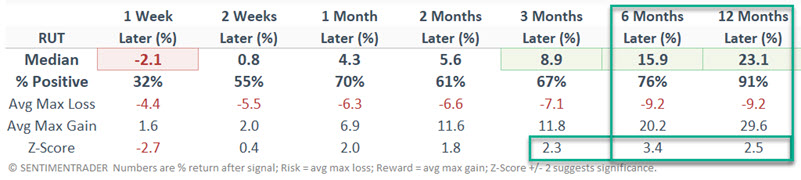
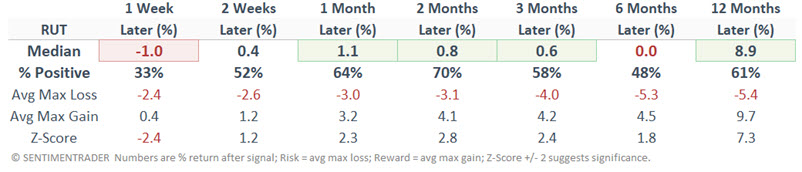
The table below summarizes RUT performance following previous signals. The most notable results are the 12-month Win Rate of 91% and the Median gain of +23.1%.
Using the 5-day rate of change as a system
We do not necessarily recommend using this as a standalone trading system. However, for illustrative purposes, let's look at the results as if we did. The trading rules are as follows:
- If the RUT 5-day rate of change crosses above +10% or more, buy and hold RUT for 12 months
- If a new cross above +10% occurs within 12 months of a previous signal, extend the holding period another 12 months
- Sell RUT 12 months after the most recent signal
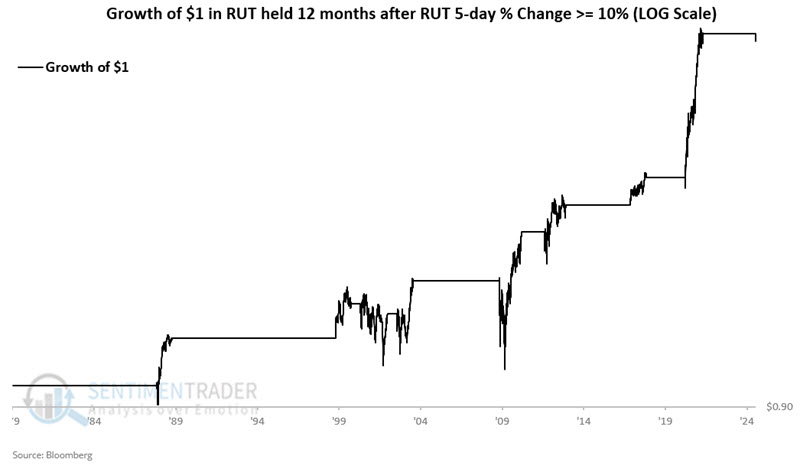
The chart below displays the hypothetical growth of $1 invested in the Russell 2000 Index using the rules above from 1979 into July 2024.
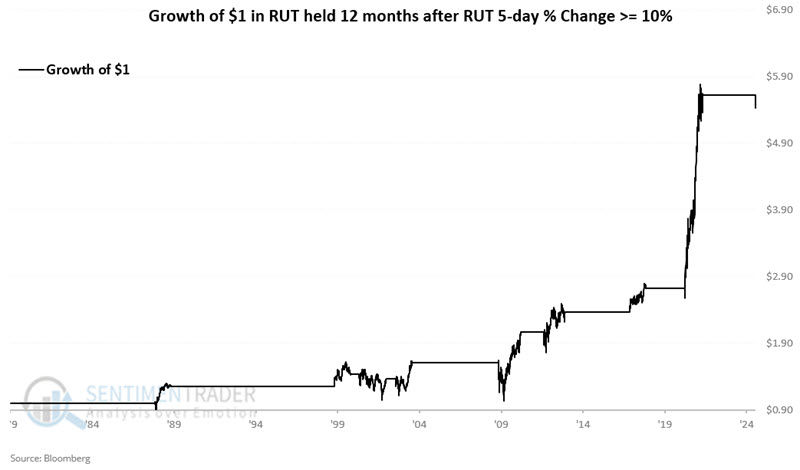
The chart below displays the same results on a logarithmic scale. The results cannot be described as "smooth sailing," as there are some significant drawdowns and periods of volatility along the way. Nevertheless, the equity curve's overall "lower left to upper right" trend is unmistakable.
Finally, the table below displays results on a signal-by-signal basis.
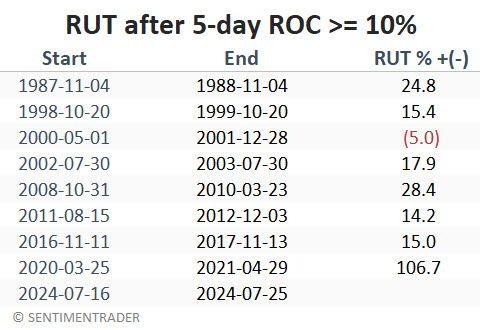
Seven of the eight completed signals showed a gain. The average return for all signals was +27.2%, and the median was +16.7%. The only loss was a -5.0% decline between May 2000 and December 2001. So far, RUT is down -1.8% since the 2024-07-16 signal.
Small caps relative to large caps
As we have seen, the recent thrust in small caps suggests good potential for further upside for small-cap stocks in the year ahead. The other question is, "Is moving away from the large caps worth it?" Here, the history is somewhat mixed. The chart and table below display the small-cap/large-cap ratio since 1978. Note that small caps have significantly underperformed large caps over the past 45+ years. The red dots highlight those dates when the Russell 2000 5-day rate of change crossed above +10%.
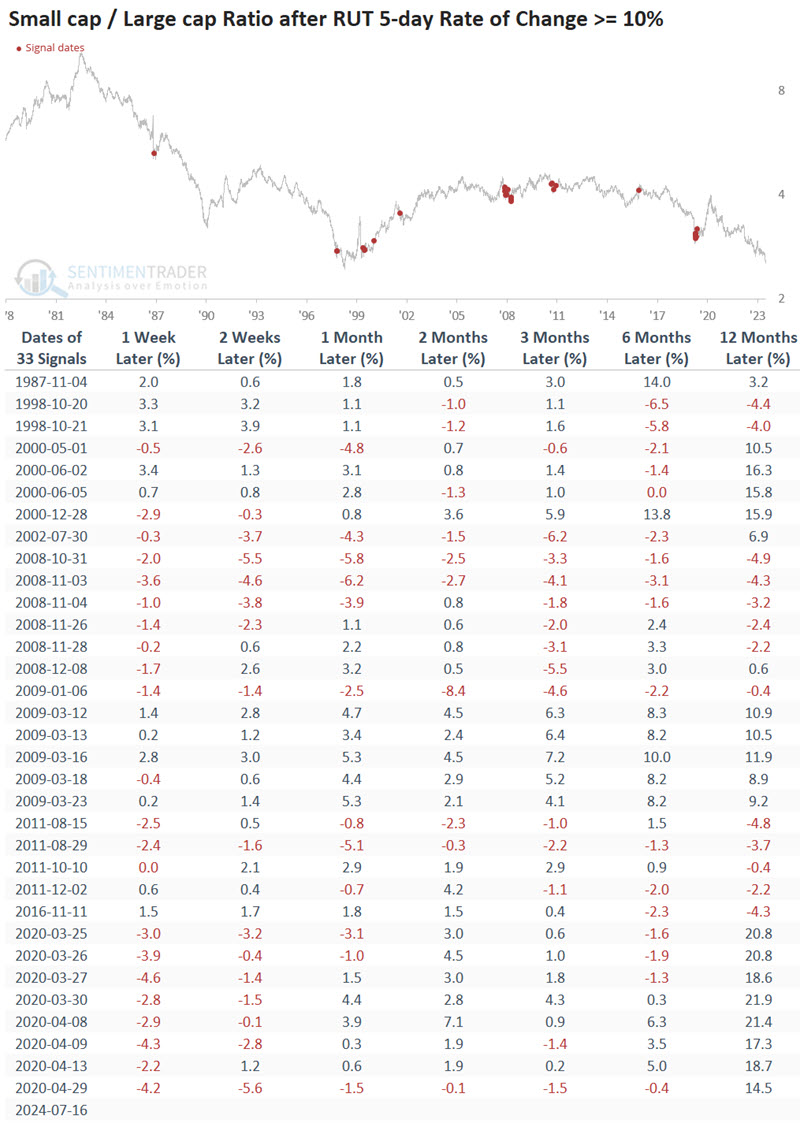
Small caps tended to show strength relative to large caps following signal dates; however, that strength was short-lived in several cases. The table below summarizes small-cap performance relative to large caps following small-cap thrusts.
What the research tells us…
Will the July thrust in small cap performance lead to continued strength for small caps in the year ahead? History suggests that investors give the bullish case for small caps the benefit of the doubt. Will small caps outperform large caps? That remains to be seen. Someday, the tide will turn back in favor of small caps. For those not willing to rely on "predictions," chances are we will only recognize that reversal of fortune in hindsight.