Products
SentimenTrader Trading Tools
‍
Backtest Engine
My Trading Toolkit
Correlation Analysis
Seasonality
Market Prediction
Indicators & Data API
‍
Proprietary Indicators & Charts
Market Data API
Strategies & Scanner
‍
50+ Trading Strategies
Smart Stock Scanner
Smart Option Scanner
Research Reports
‍
Research Solutions
Reports Library
Free Resources
Simple Backtest Calculator
Simple Seasonality Calculator
The Kelly Criterion Calculator
Sentiment Geo Map
Public Research Reports
Education
Sentiment Indicators
Technical Indicators
Pricing
Company
About
In the News
Testimonials
Client Success Stories
Contact
Log inLoginSign up
< BACK TO ALL REPORTS

The real summer rally period

Jay Kaeppel
2022-06-27
The summer months of June, July, and August as a whole can fairly be described as "Summer doldrums" regarding the stock market. There is one period, however, that tends to shine. We highlight this period and the comparative results herein.

Key Points

  • The phrase "Dog Days of Summer" applies very aptly to overall stock market performance during the summer months of June, July, and August
  • One period tends to shine (and makes the rest of the summer look that much worst by comparison)

June, July, and August

The chart below displays the cumulative % return for an investor who held a long position in the S&P 500 Index every year ONLY during June, July, and August, starting in 1940 (through 6/23/2022).

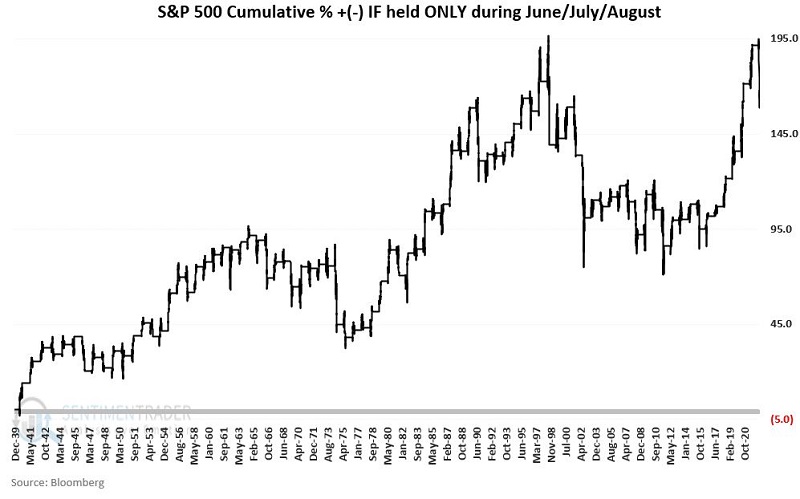
At a glance, the results seem OK, if a bit choppy. The cumulative % gain was +168%. Before looking more closely for a "summer rally," let's first put this in perspective versus the rest of the year.

All Other Months

To put the June/July/August returns from the chart above into perspective, the chart below displays:

  • Cumulative % return for an investor who held a long position in the S&P 500 Index every year ONLY during June, July, and August, starting in 1940 (red line = +168%). In other words: The black line from the chart above is the red line in the chart below.         
  • Cumulative % return for an investor who held a long position in the S&P 500 Index every year ONLY during ALL MONTHS OTHER THAN June, July, and August, starting in 1940 (black line = +11,240%)    

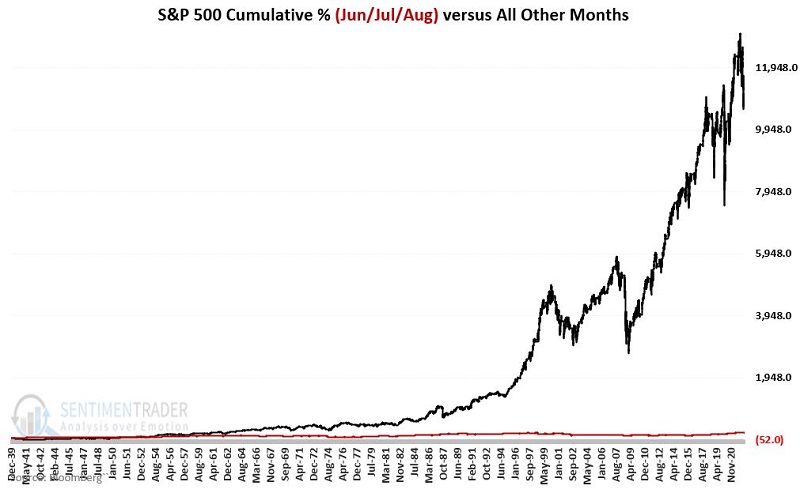
All of a sudden, summer month returns don't look so great.

The Summer Rally Period

The period we will focus on incorporates 12 trading days by combining:

  • The last three trading days of June
  • The first nine trading days of July

We will refer to this as the "Summer Rally Period." For 2022, this period extends from the close on 6/27/2022 through the closing on 7/14/2022.

We will refer to all other trading days during June, July, and August as "All Other Summer Days."

In the chart below:

  • The black line displays the cumulative return (+209%) for SPX during the "Summer Rally Period"
  • The red line shows the cumulative return (-13%) for SPX during "All Other Summer Days"

The test period extends from 1940 through June 23rd, 2022.

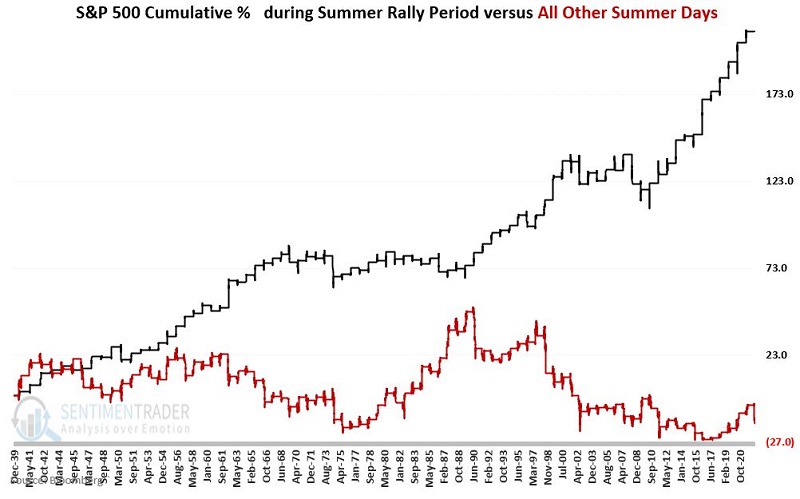
The S&P 500 Index has lost ground during "All Other Summer Days." Of course, results can vary widely from year-to-year.
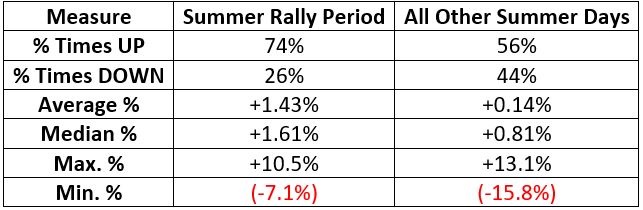
Summary of Results

The table below displays a "Summery" er, summary of results for Summer Rally Periods versus All Other Summer Days.

What the research tells us…

As with any seasonal trend, results can vary widely from year-to-year. That said, investors looking to avoid the "Summertime Blues" might be best advised to give the market the benefit of the doubt from late June into early July.

PRODUCTS
SentimenTrader
Trading Tools
Indicators & Data API
‍
Strategies & Scanner
‍
Research Reports
FREE
RESOUrCES
Simple Backtest
Calculator
Simple Seasonality
Calculator
The Kelly Criterion
Calculator
Sentiment Geo Map
‍
Public Research Reports
‍
Education
Sentiment Indicators
‍
Technical Indicators
‍
Pricing
Bundle pricing
‍
FAQ
‍
Announcements
‍
COMPANY
‍
About
‍
In the News
‍
Testimonials
‍
Client Success Stories
CONTACT
‍
General Inquiries
‍
Media Inquiries
‍
Financial Professionals Inquiries
‍
© 2026 Sundial Capital Research Inc. All rights reserved.
Setsail Marketing
TermsPrivacyAffiliate Program
Risk Disclosure: The information and tools provided are for research and analytical purposes only and are not intended as investment advice. Market analysis involves uncertainty, and outcomes may differ from expectations. Users should conduct their own due diligence and consider their individual circumstances before making any financial decisions. Past performance is not necessarily indicative of future results.

Hypothetical Performance Disclosure: Hypothetical performance results have many inherent limitations, some of which are described below. No representation is being made that any account will or is likely to achieve profits or losses similar to those shown; in fact, there are frequently sharp differences between hypothetical performance results and the actual results subsequently achieved by any particular trading program. One of the limitations of hypothetical performance results is that they are generally prepared with the benefit of hindsight. In addition, hypothetical trading does not involve financial risk, and no hypothetical trading record can completely account for the impact of financial risk of actual trading. for example, the ability to withstand losses or to adhere to a particular trading program in spite of trading losses are material points which can also adversely affect actual trading results. There are numerous other factors related to the markets in general or to the implementation of any specific trading program which cannot be fully accounted for in the preparation of hypothetical performance results and all which can adversely affect trading results.

Testimonial Disclosure: Testimonials appearing on this website may not be representative of other clients or customers and is not a guarantee of future performance or success.