
The real (estate) summer rally period

Key Points
- The overall stock market has shown a long-term tendency to be quite uninspiring from June into September
- The real estate sector has shown a long-term tendency to outperform the overall stock market during this typical period of "summer doldrums
- Another potentially positive factor involves overly bearish sentiment in the real estate sector
June, July, and August for the broader market
The chart below (from this article) displays the cumulative % return for an investor who held a long position in the S&P 500 Index every year ONLY during June, July, and August, starting in 1940 (through 6/23/2022).
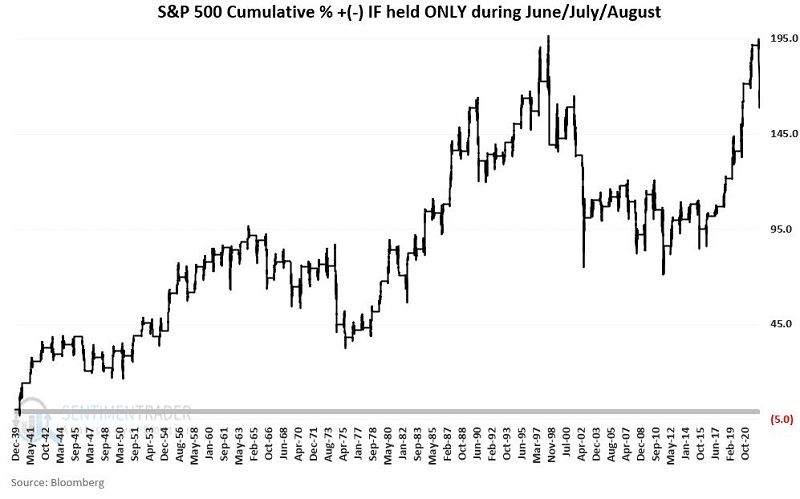
The cumulative gain through 6/23/2022 was +168%. Not horrible, but certainly not great.
Real estate sector: TDY #121 through TDY #172
The chart below displays the annual seasonal trend for ticker IYR (iShares U.S. Real Estate ETF).
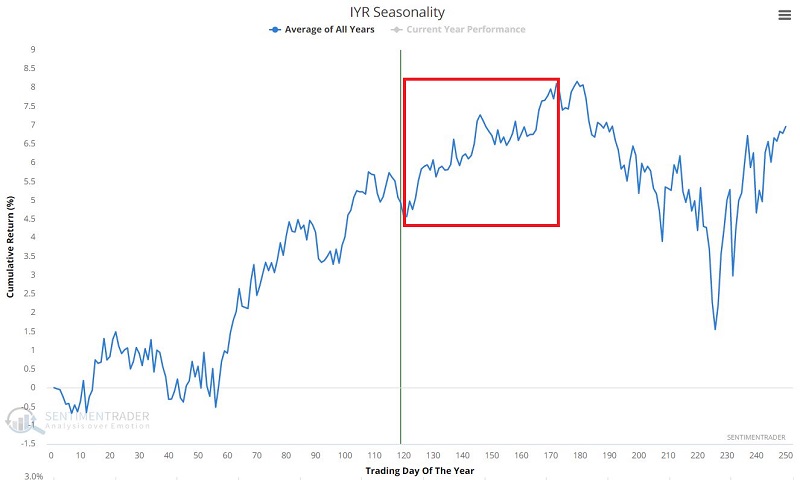
Note the seasonally favorable period that extends from Trading Day of the Year (TDY) #121 through TDY #172. For 2022, this period extends from the close on 6/27/2022 through the close on 9/8/2022.
The test
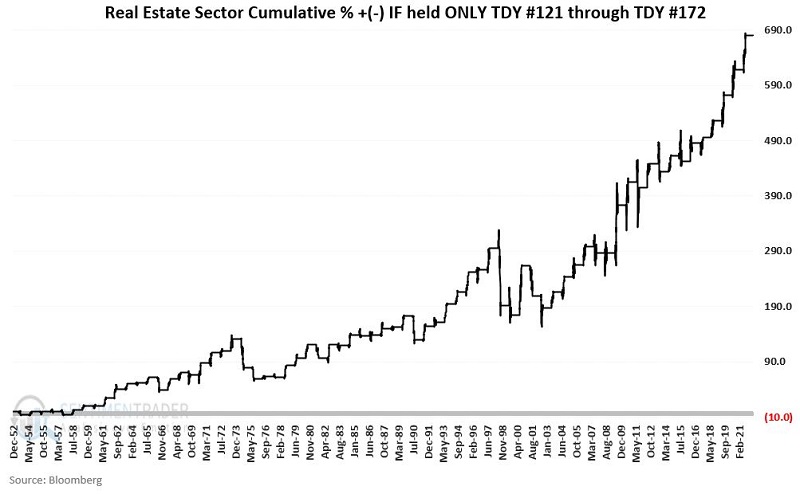
For testing purposes, we will use real estate sector data from 1953 through 2021 (Fama French database from 1953 through 1990 and the S&P 500 Real Estate sector after that).
The chart below displays the cumulative % growth for the real estate sector if held only during the seasonally favorable period each year from 1953 through 2021. The cumulative hypothetical % gain was +680%.
Real estate versus S&P 500 Index
Now let's compare the performance of the real estate sector during the seasonally favorable period versus the performance of the S&P 500 Index.
- The black line in the chart below displays the same information as the above chart
- The red line shows the hypothetical cumulative growth for the S&P 500 Index if held only from TDY #121 through TDY #172 each year from 1953 through 2021
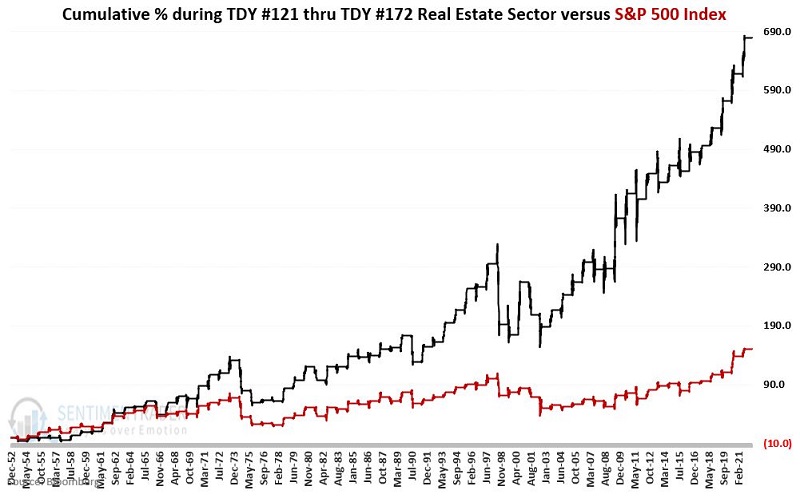
The cumulative hypothetical % gain for the real estate sector was +680%, versus +151% for the S&P 500.
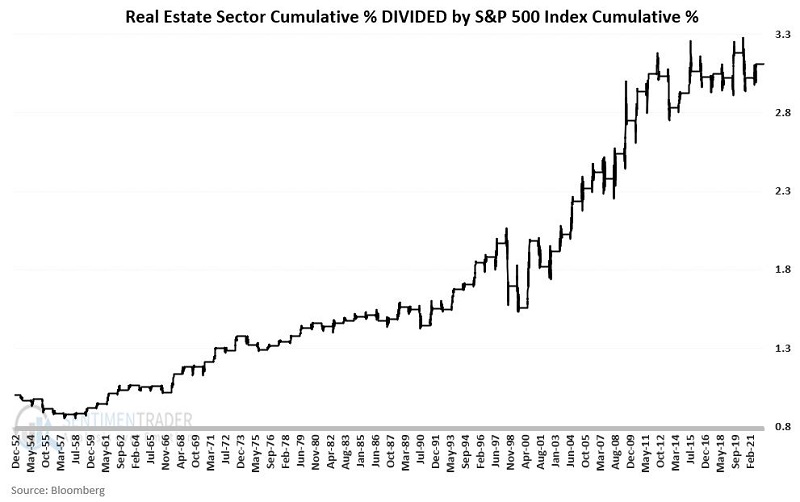
To better illustrate the relative performance, the chart below divides the cumulative % for real estate by the cumulative % for the S&P 500.
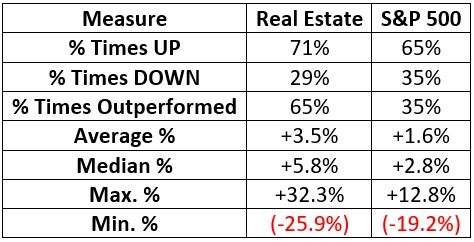
Summary of Results
The table below summarizes absolute and comparative results for real estate versus SPX.
A potential bonus: Sentiment
Sentiment regarding the real estate sector has been quite unfavorable in 2022. As a contrarian indicator, these signals have been useful so far this year for short-term traders. Historically, this level of bearishness among investors has been mostly favorable across all timeframes up to twelve months.
The chart below displays those occasions when the 5-day average of XLRE (name) Optix crossed below 13 for the first time in a month. The table shows a summary of past performance.
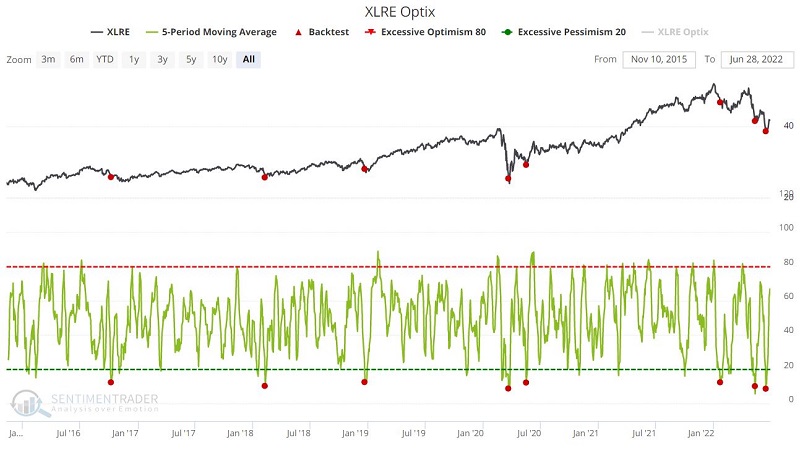
The Win Rates and Median returns have been quite positive. However, it is essential to note that this is a relatively short test (XLRE started trading in 2015), so we should NOT assume that such favorable results will always follow every future signal.
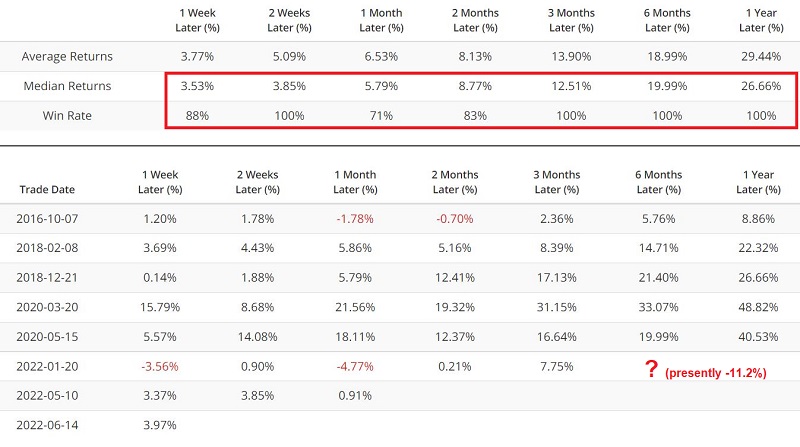
The chart below takes a closer look at the three signals that have occurred during 2022.
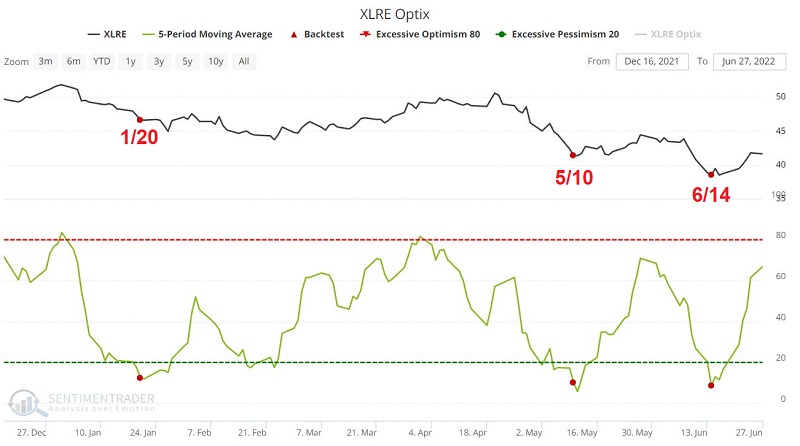
The 1/20/2022 signal was favorable over the first three months (+7.75%) but has been down significantly since then (presently -11.2% BELOW its price on 1/20/2022). The jury is still out on the May and June signals. Given the overall downtrend in XLRE prices, some caution may be in order for conservative investors and traders. However, more aggressive traders might focus on the potentially powerful combination of seasonality and sentiment.
What the research tells us…
As with any seasonal trend, results can vary widely from year-to-year. As the results above demonstrate, in some years, real estate will show a gain (71%) during the seasonally favorable period, and sometimes it will show a loss (29%). Likewise, sometimes real estate will outperform the S&P 500 (65% of the time), and sometimes it will lag (35%). One of the keys to long-term investment success is finding an "edge" and exploiting it as often as possible. After a decade+ of strong relative performance for the S&P 500 Index, history suggests the possibility that real estate will exert its long-term edge over the S&P 500 in the years ahead during the summer seasonally favorable period.
In the near term, Between January 1st and mid-June, XLRE declined by 25% peak-to-valley before bouncing roughly +7.6%. On the fundamental side, one can argue that there are many reasons (rising mortgage rates, sky-high home prices, concerns about empty commercial real estate, etc.) to expect trouble to continue in the real estate sector.
But the other question is, "how much have those concerns already been factored in," given the swift severe overall decline in real estate sector stock prices so far this year? The combination of a reliable long-term seasonal trend and overly bearish sentiment (i.e., low Optix) may indicate that the real estate sector may surprise many people in the next several months.