
The Q1 Combined Model

Key points
- As discussed here, here and here, the action of the S&P 500 in Q1 can offer clues regarding performance for the rest of the year
- A Q1 gain above 5%, any Q1 gain after a down year, and a Q1 low above the previous December low have all typically been followed by further gains
- In this piece, we add the three measures together into one Q1Combined Model
A quick review
The first indicator is rated as favorable if the lowest close for the S&P 500 during the first quarter is above the lowest close registered during December of the previous year.
The second indicator is rated as favorable if Q1 shows a gain of any size if the previous year saw the S&P 500 register a loss for the year.
The third indicator is rated as favorable if the S&P 500 shows a Q1 gain of +5% or higher.
We will assign each indicator a reading of +1 if it is rated favorable at the end of March. Otherwise, it remains as a 0.
The Q1 Combined Model summarizes the readings for these three indicators at the end of March each year. For any given year, the Combined Model can read +3, +2, +1, or 0 for the remaining nine months of the current calendar year.
The test started in 1950. For each year, we will examine the status of the Q1 Combined Indicator at the end of March and the subsequent performance of the S&P 500 during the remainder of the year.
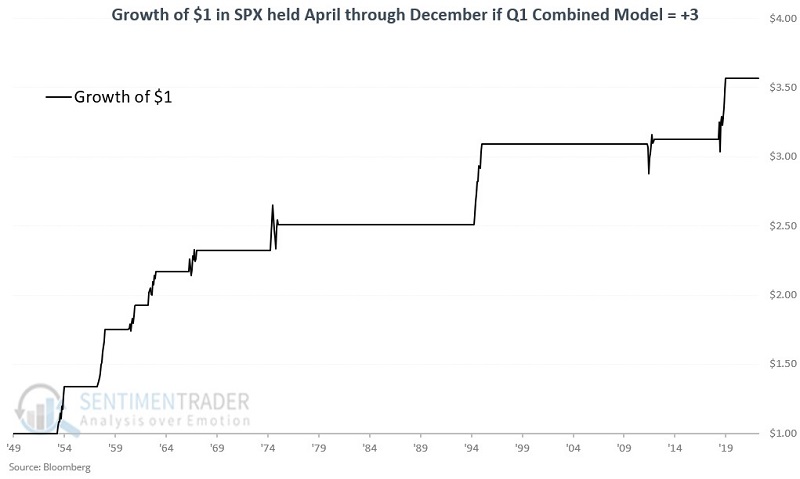
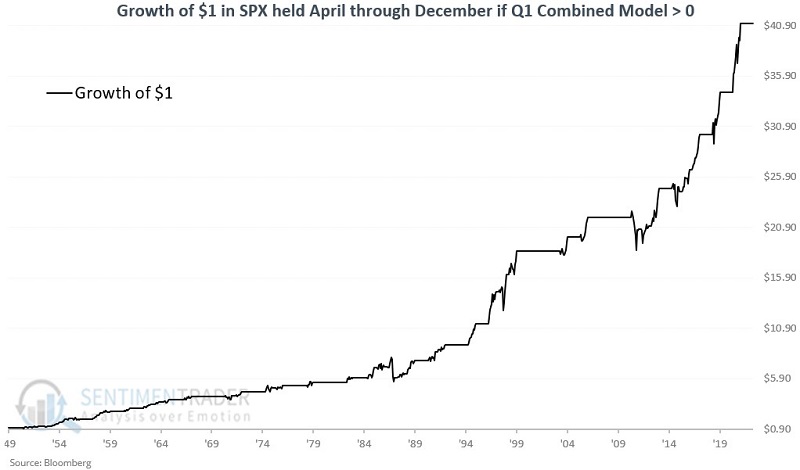
Readings of +3
The Q1 Combined Model reading at the end of March 2023 is +3. Only nine previous years have had a Q1 Combined Model reading of +3. All nine showed an April through December gain (a summary table appears below). The chart below displays the growth of $1 in the S&P 500 held only for the last nine months of +3 years.
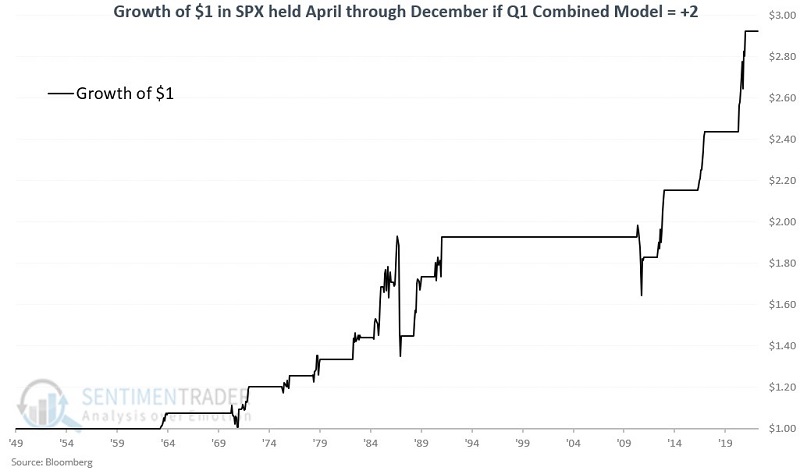
Readings of +2
There have been fifteen years with a Q1 Combined Model reading of +2. Thirteen of those years showed an April through December gain. The chart below displays the growth of $1 in the S&P 500 held only for the last nine months of +2 years.
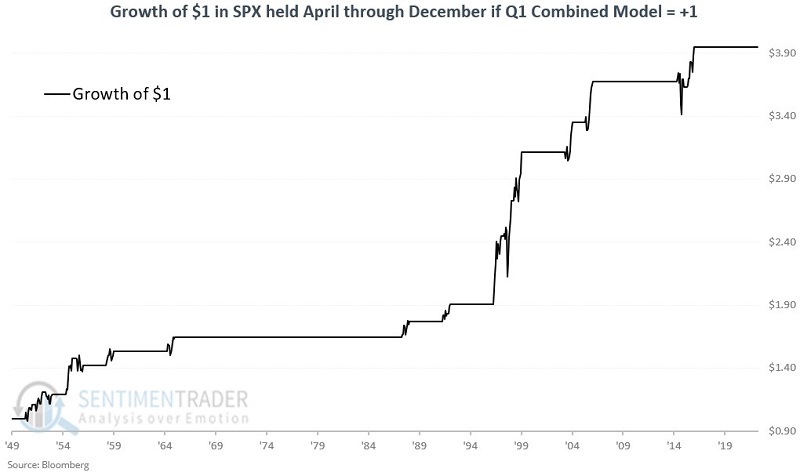
Readings of +1
There have been sixteen years with a Q1 Combined Model reading of +1. Thirteen of those years showed an April through December gain. The chart below displays the growth of $1 in the S&P 500 held only for the last nine months of +1 years.
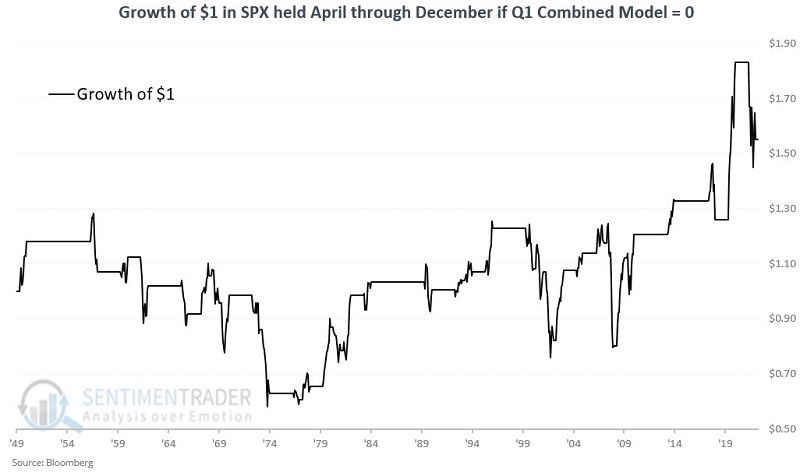
Readings of 0
There have been thirty-three years with a Q1 Combined Model reading of 0. Eighteen of those years showed an April through December gain. The chart below displays the growth of $1 in the S&P 500 held only for the last nine months of 0 years.
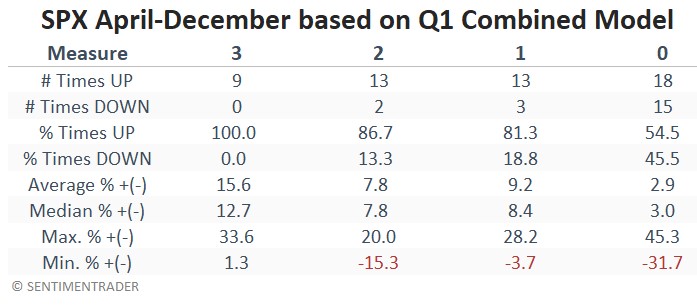
Summary of different readings
The table below displays a summary of April through December performance results for the S&P 500 Index based on the Q1 Combined Model reading at the end of March each year.
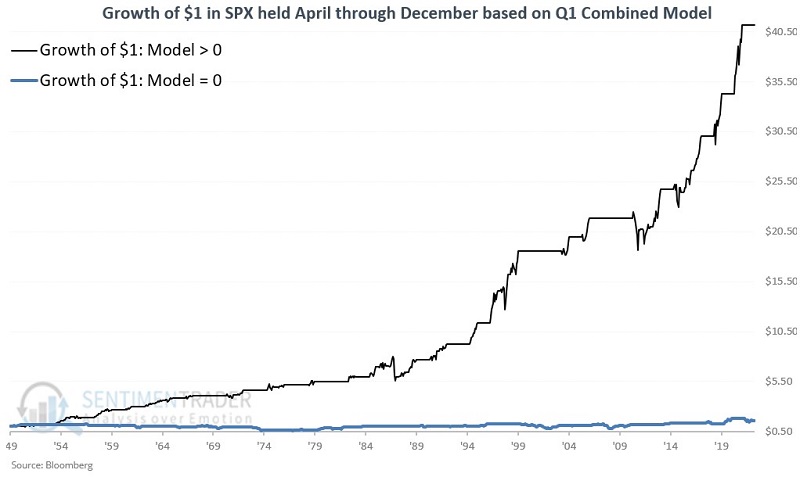
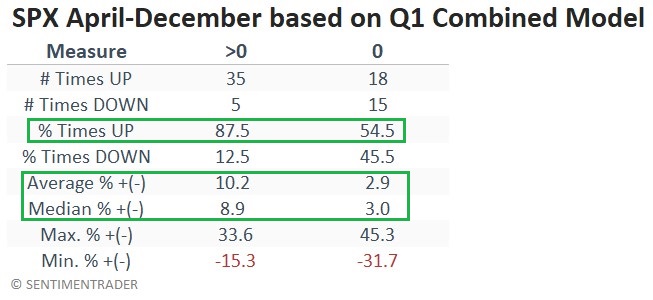
Any reading above 0 versus readings of 0
For argument's sake, let's assume a trader would hold the S&P from April through December as long as the Q1 Combined Model shows a reading above 0. The chart below displays the equity curve for this approach.
To put results in perspective, the chart below displays the growth of $1 in the S&P if the Q1 Combined Model reading is greater than 0 (black line) AND the growth of $1 in the S&P if the Q1 Combined Model reading is equal to 0 (blue line).
The table below summarizes April through December S&P 500 performance based on whether the Q1 Combined Model is above 0 or equal to 0.
What the research tells us…
The good news is that at the end of March 2023, the Q1 Combined Model stood at its highest possible reading of +3. The nine previous +3 readings saw the S&P 500 rise each time between the end of March and the end of the year, with an average gain of +15.6%. The bad news is that a +3 reading does not guarantee that 2023 will resemble the previous +3 years. It merely tells us that there was enough thrust in the market in Q1 to sustain a further rally potentially.
Another thing to note is that while years that showed a reading of 0 included a number of bear market years and very choppy results overall, those years combined DID show a net gain. That means an investor who attempted to use the Q1 Combined Model as a standalone trading tool would have underperformed a buy-and-hold strategy (albeit with vastly lower downside volatility) over the past 70+ years. This suggests that investors use the Q1 Combined Model as a vital clue in a more significant "weight of the evidence" approach.