
The problem with the 'Technology is Dead' narrative

Key Points
- From December into May, ticker XLK (Technology Select Sector SPDR Fund) fell -29% before rebounding slightly
- The narrative among pundits seems to suggest that this is just the beginning of a 2000-2002 type collapse
- The problem with this line of thinking is that corporate insiders are acting bullish, and speculators are acting bearish
- That is typically not a recipe for a continued significant decline
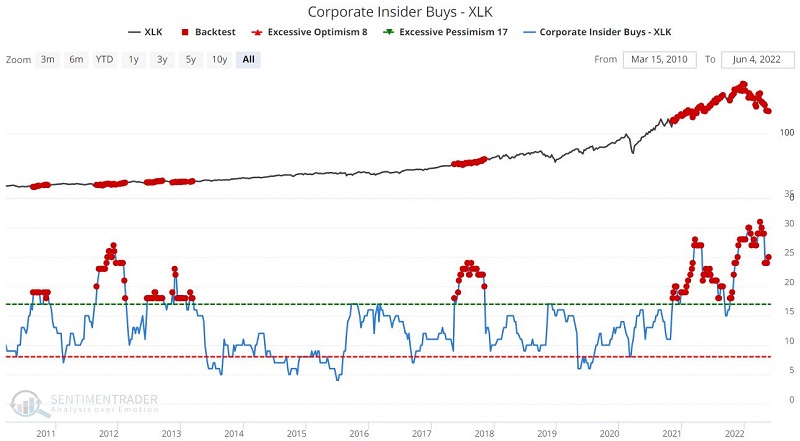
XLK Insiders are buying…
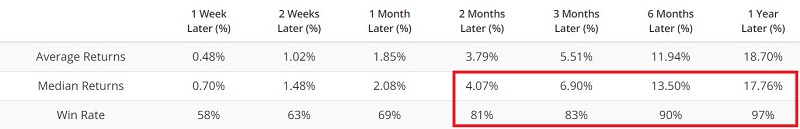
XLK insider buying picked up significantly starting in November 2020. Amazingly, they kept buying heavily during the rally in 2021 and kept right on buying heavily throughout the 2022 decline. The chart below displays those weeks when our Corporate Insider Buys - XLK stood above 17. The table below that shows a summary of performance results. Tech insiders may be wrong this time around. But historically, they are not usually wrong when they act en masse.
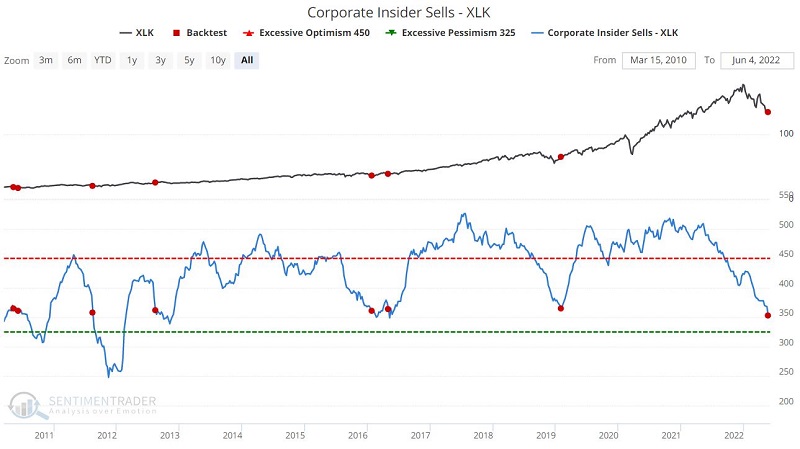
… and XLK Insiders have dialed back on selling
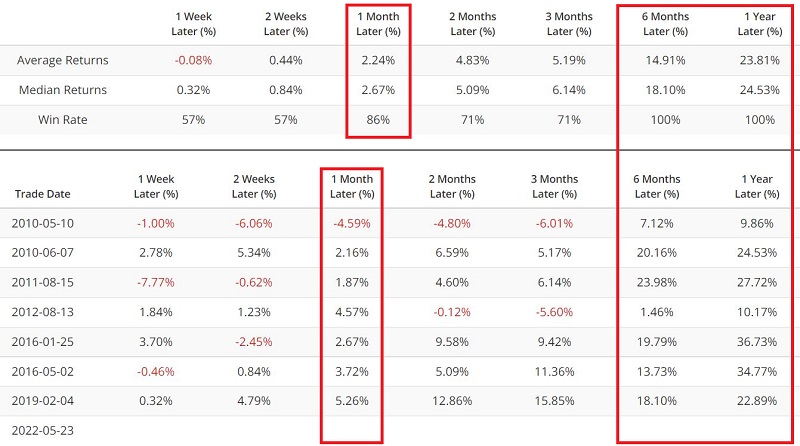
While strong insider XLK buying continues unabated, XLK insider selling has steadily declined over the past year. The chart below displays those weeks when our Corporate Insider Sells - XLK stood below 365. The table below that shows a summary of performance results.
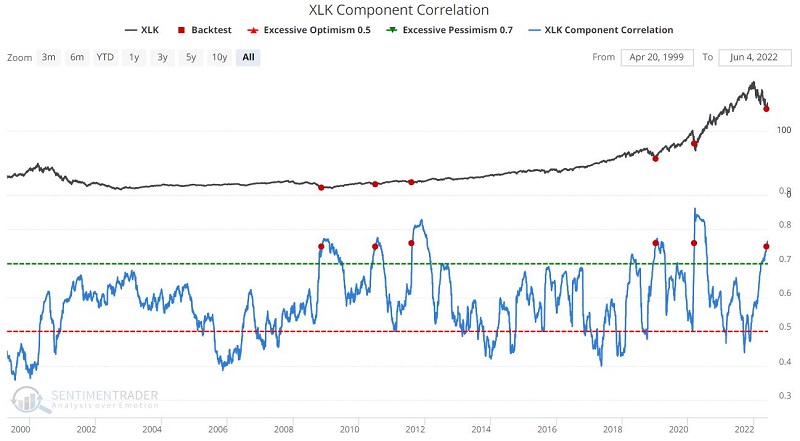
XLK Component Correlation soars
Component correlation measures the degree to which the stocks in an index are trending similarly. Typically, high readings tend to be bullish. A high reading during a price downtrend suggests that investors are dumping the stocks in the index indiscriminately.
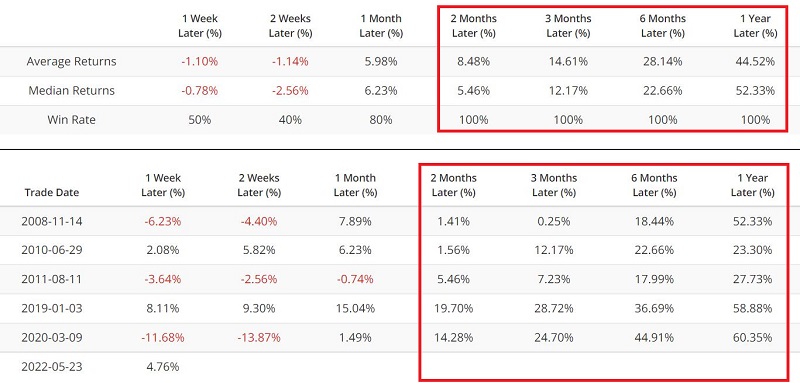
The chart below displays those weeks when our XLK Component Correlation was above 0.75 for the first time in six months.
Aggregated Put/Call Ratio is elevated
The Aggregated Put/Call ratio is another sign that investors are giving up on tech stocks. When this ratio reaches a high level, options traders are betting heavily against tech stocks by buying many put options relative to the number of call options purchased.
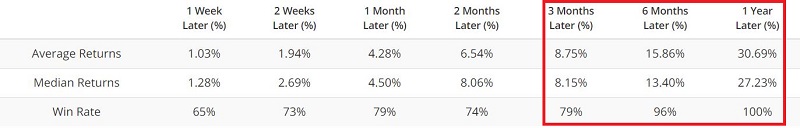
The chart below displays all days when the 10-day average for XLK Aggregated Put/Call Ratio was above 0.80. The table below displays a summary of the results.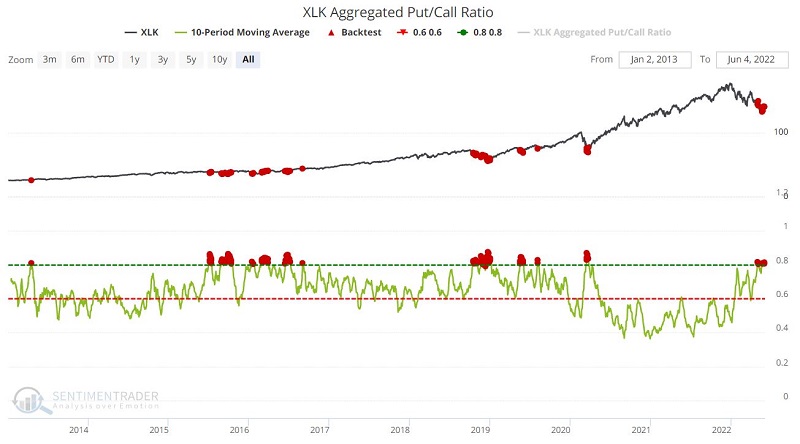
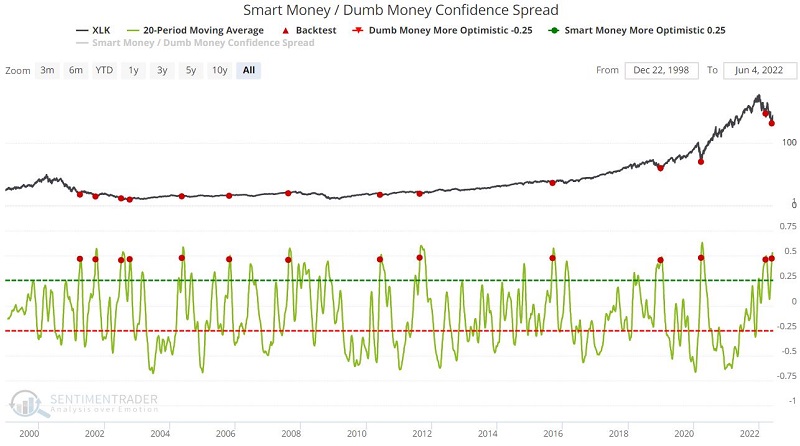
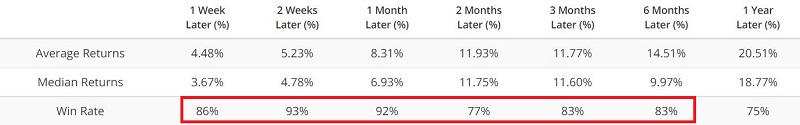
XLK performance following previous Smart/Dumb Money extremes
Our Smart Money/Dumb Money Confidence Spread recently reached an important extreme. Historically, the technology sector has responded well following these signals. The chart below displays those days when the 20-day moving average for our Smart Money/Dumb Money Confidence Spread crossed above 0.45 for the first time in 21 days. The table below displays a summary of XLK performance results.
What the research tells us…
The "story" is that technology sector stocks got "too overvalued" during the 2020-2021 bull market and are now due for a comeuppance on a par with the 2000-2002 bear market. And maybe they are. But the potential "fly in the ointment" to this line of argument is that technology corporate insiders are bullish and retail traders are bearish. Historically, that is a recipe for favorable action, not a continued bearish decline.