
The problem with a lagging semiconductor sector

Key points:
- Semiconductor stocks have been struggling, both absolutely and relative to the broader market
- Similar bouts of relative semi weakness have preceded some trouble spots for stocks
- A badly lagging semi sector had no ill effect in the mid-1990s, but that was one of the few exceptions
The "new transports" are struggling
"Semiconductors are the new Transports."
Market watchers have long asserted this, and it's an intriguing take. In decades past, the health of the U.S. economy could reliably be judged by the activity of transportation companies. The new digital-first economy is supported by a different backbone, and that backbone could reasonably be considered the semiconductor industry.
That seems to be a problem now. While the S&P 500 has been hitting record highs, semis have not.
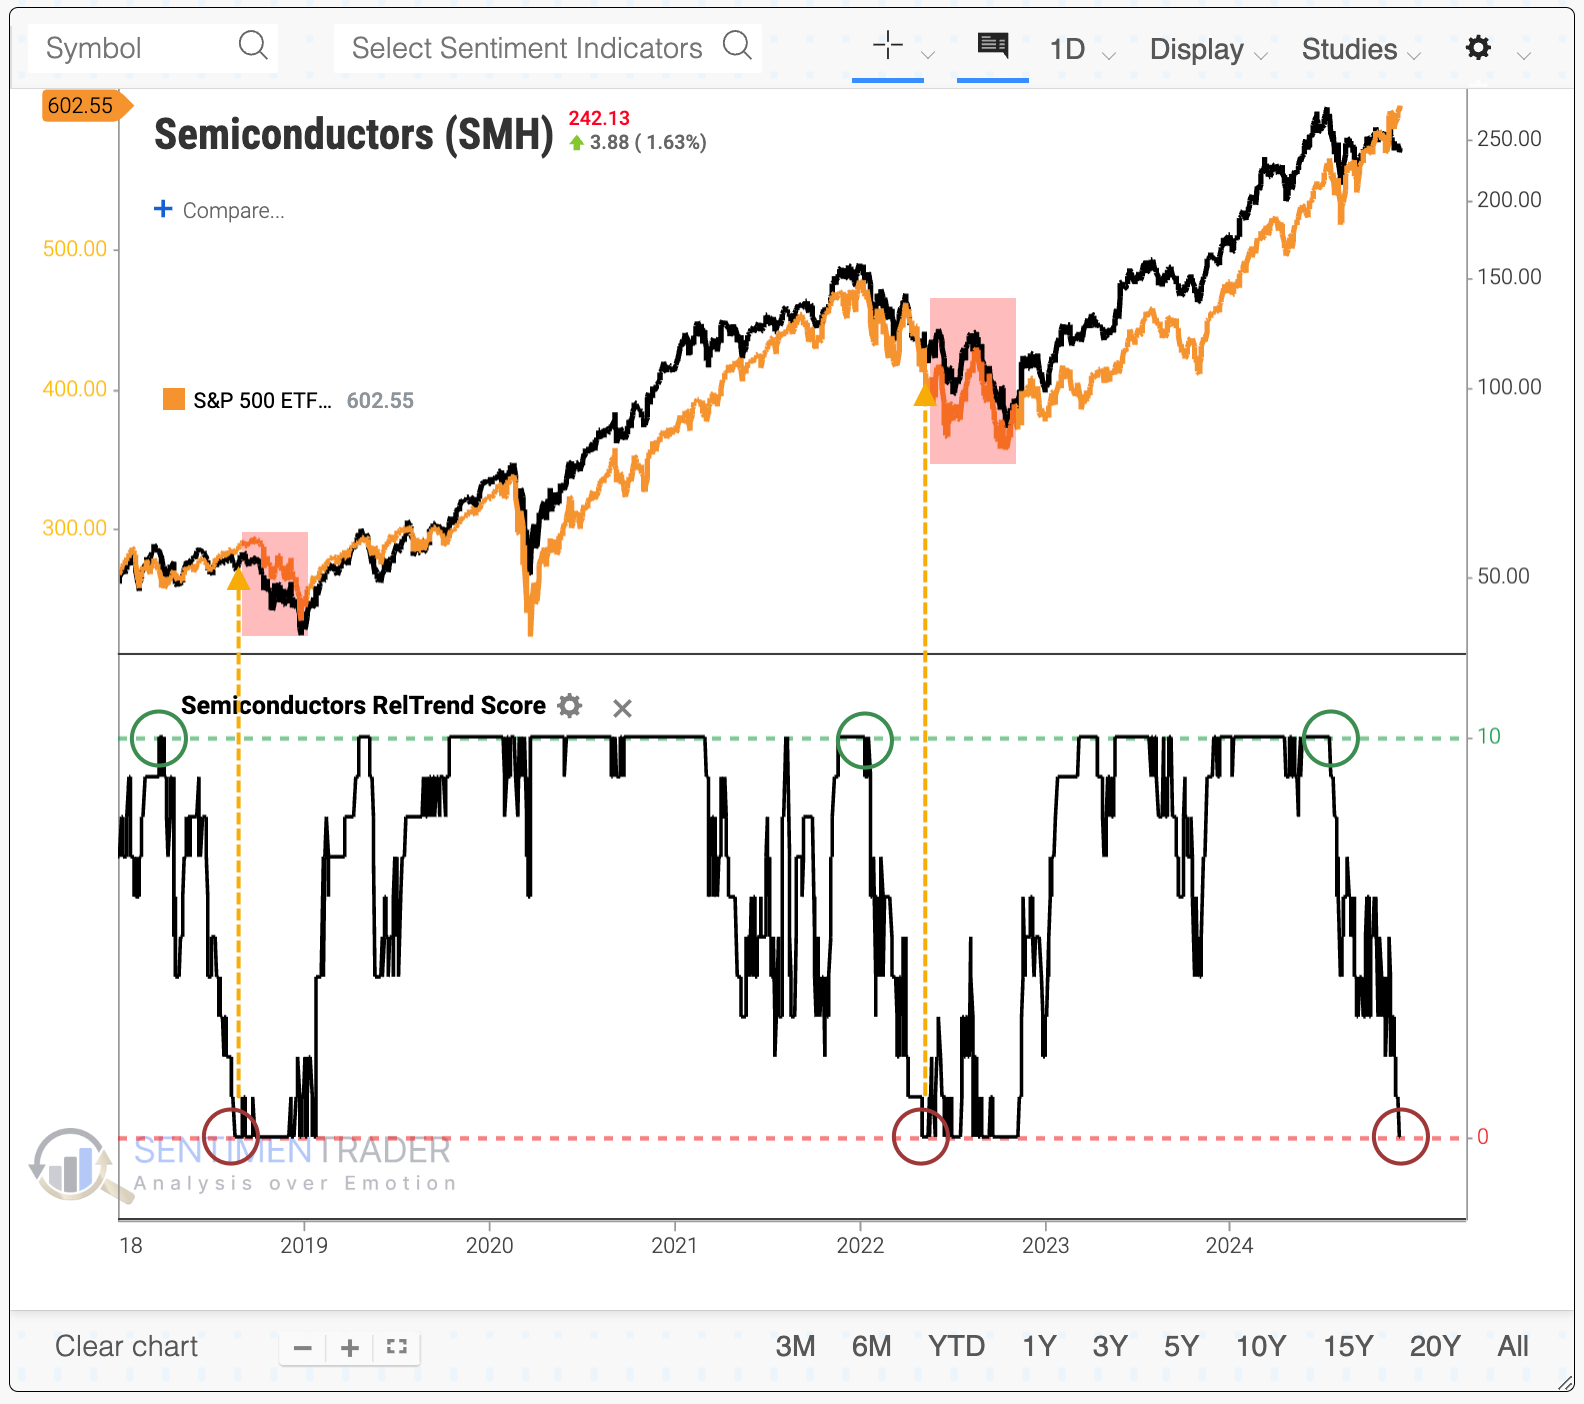
The tech team at SentimenTrader has rolled out a significant number of developments, including absolute and relative trend scores for thousands of indices, ETFs, and stocks. When we look at the relative trend for the VanEck Semiconductor ETF (SMH), we can quickly see the problem: its Relative Trend Score has cycled from 10 (all of the trend metrics for the SMH/S&P 500 ratio are positive) to 0 (none of them are). The last couple of times this happened, it was not good for semis or the broader market.
Using Backtest Engine 2.0, we can see that throughout the history of SMH, when its Relative Trend Score has cycled from 10 to 0, the fund has had a tough time holding a rebound. Over the next six months, SMH suffered a negative return all but one time. You can click here to load the same parameters for this test - just scroll down and click the Run Backtest button to run it.
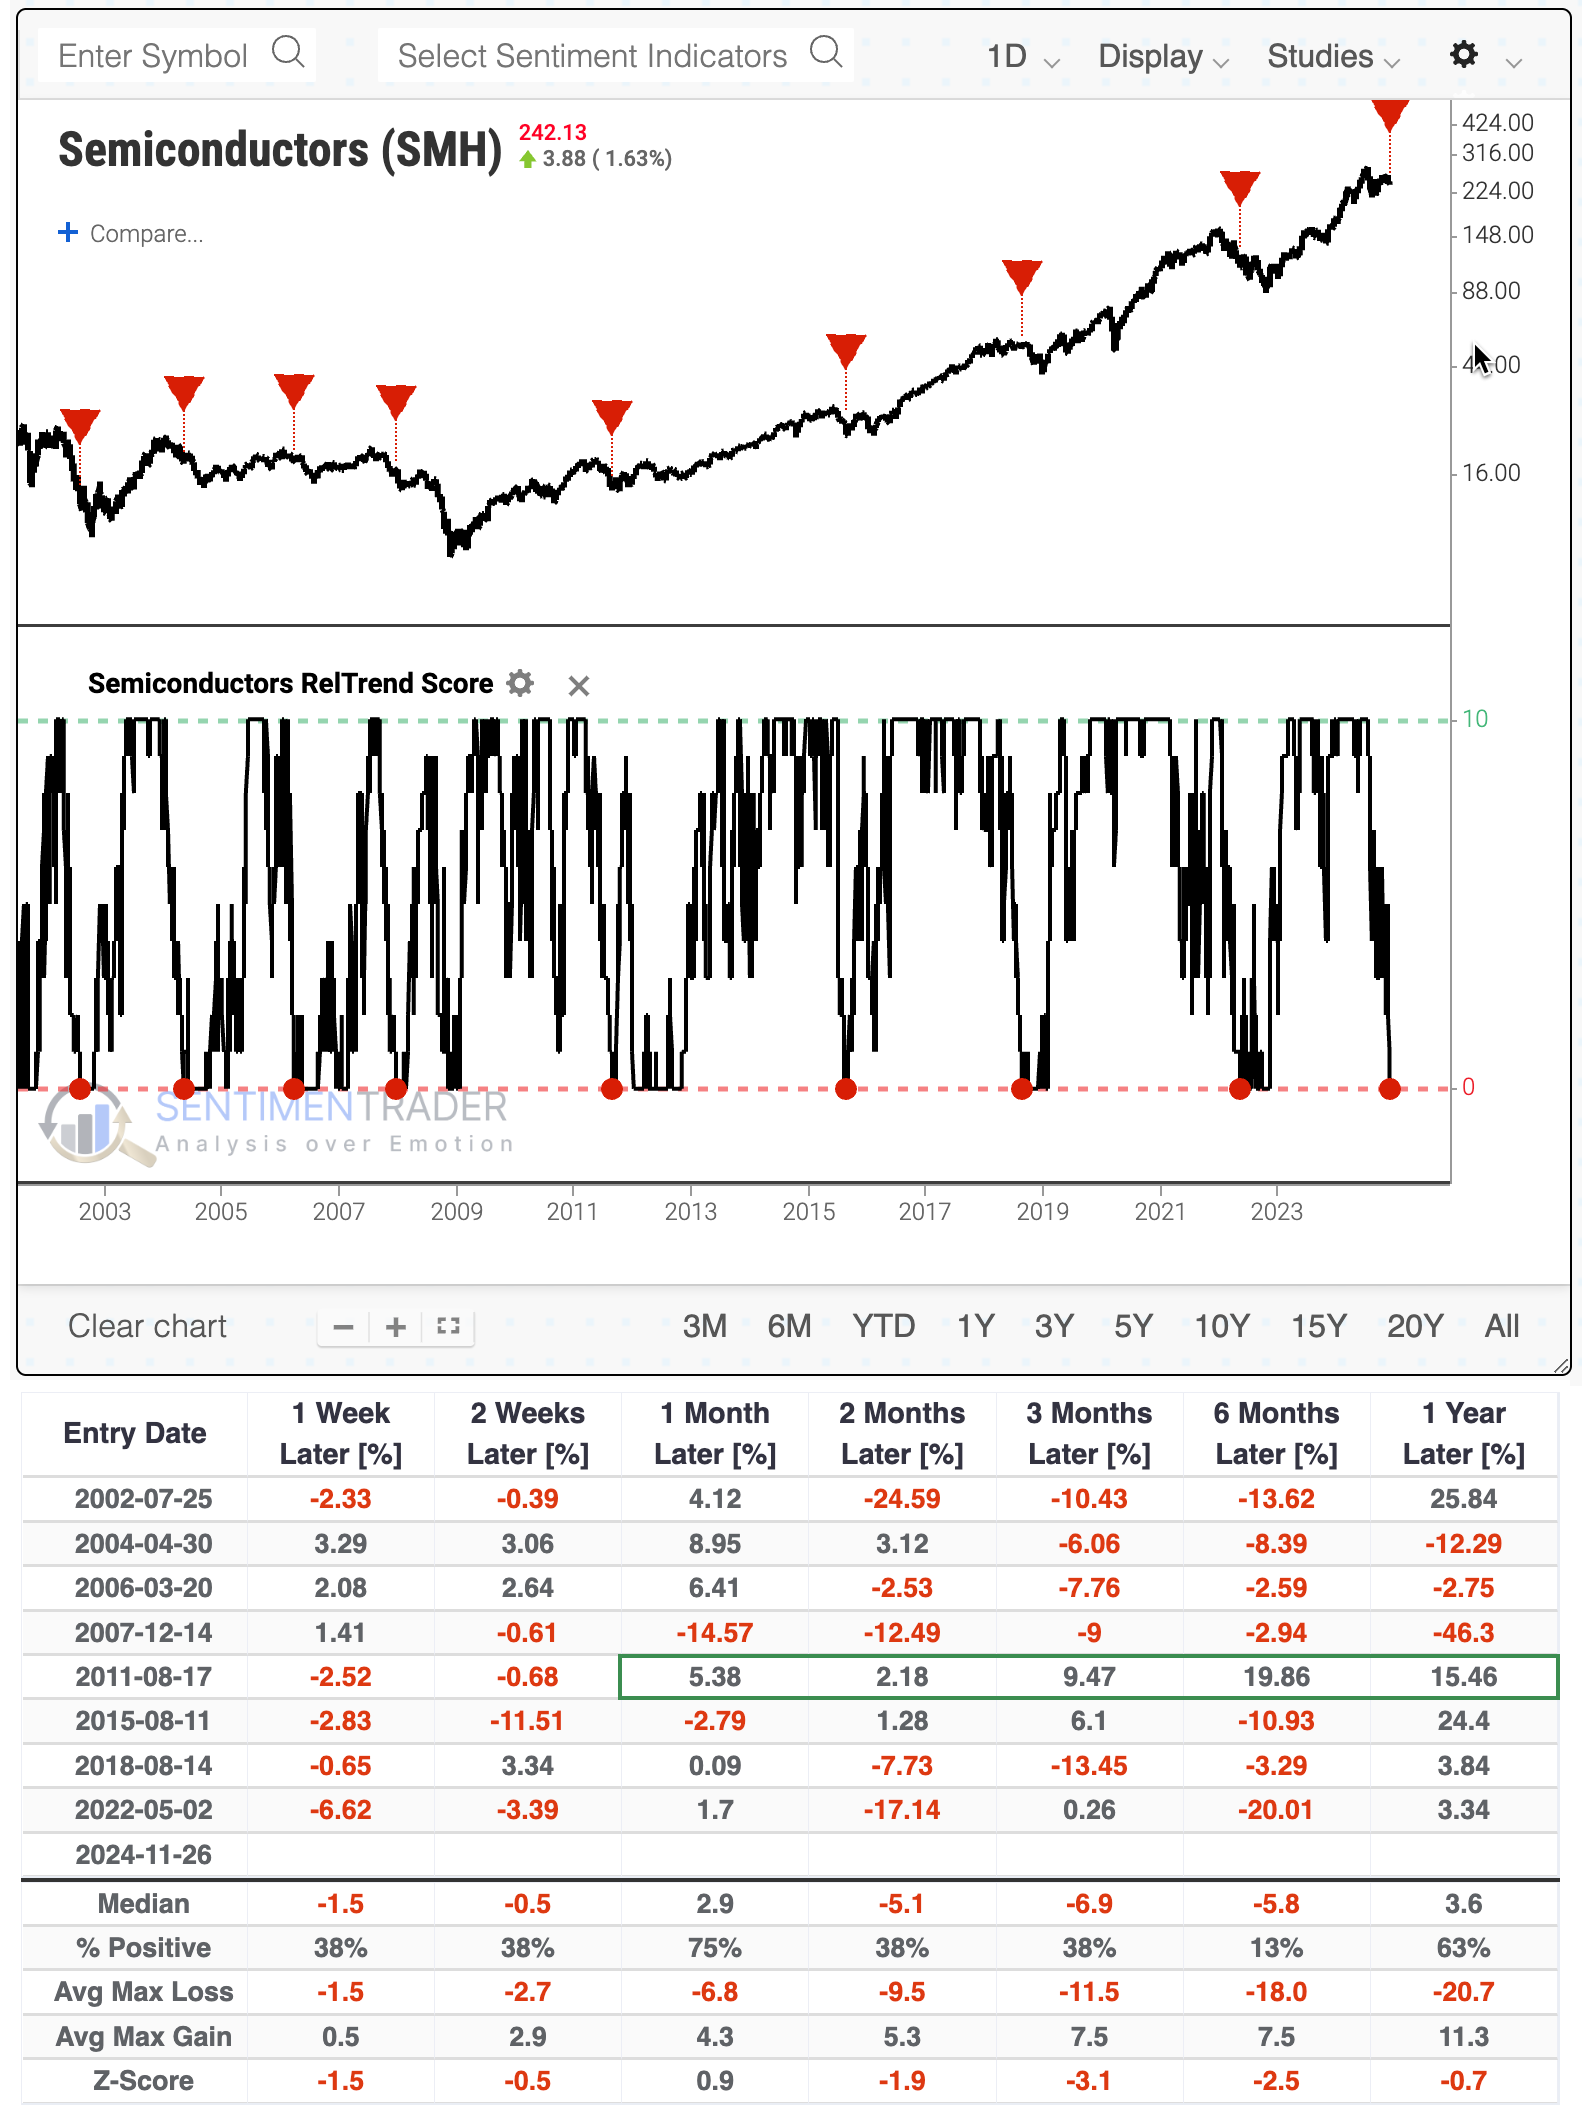
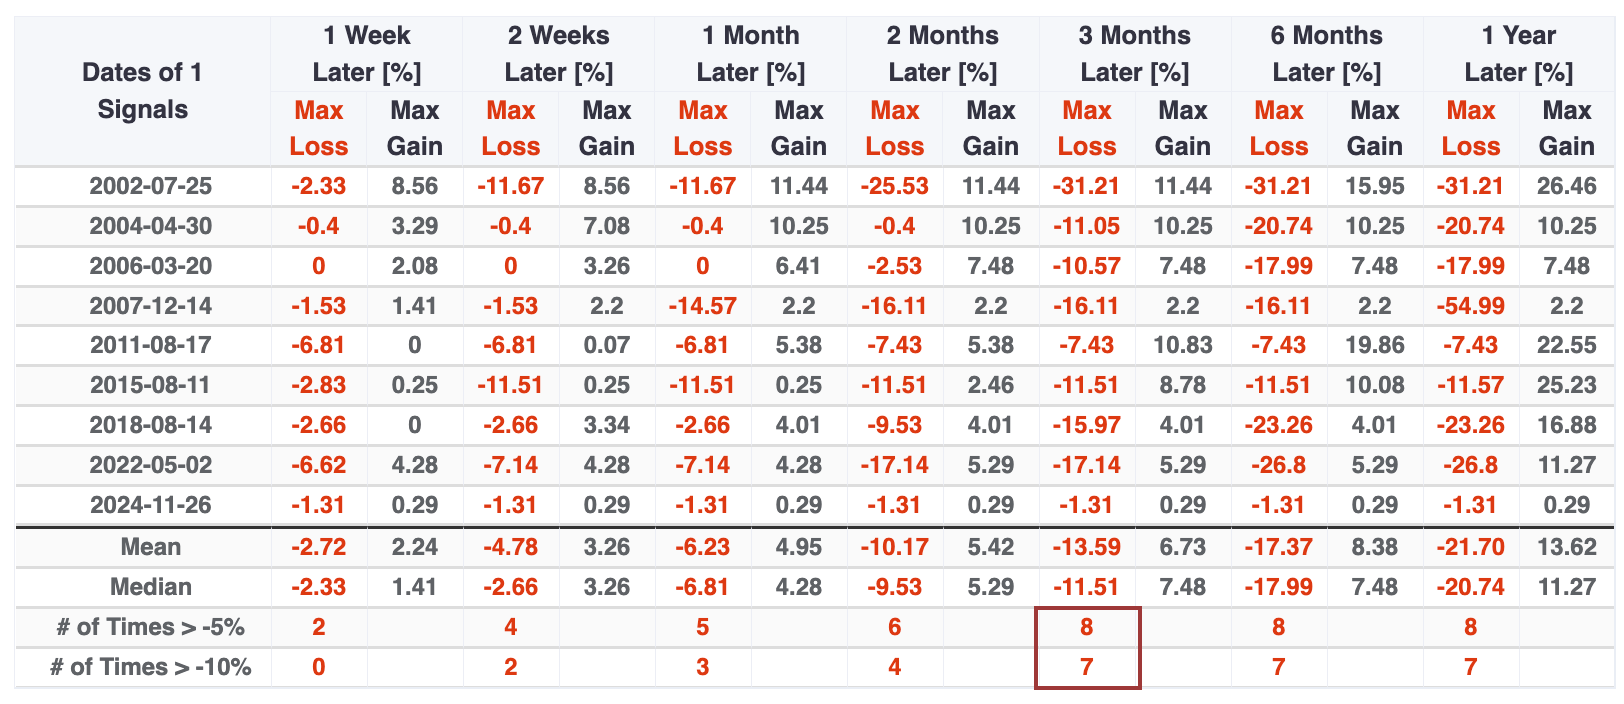
The table of maximum gains and losses across time frames shows that SMH suffered at least a -5% pullback within the next three months every time (not including the last signal, which was just triggered). And it suffered at least a -10% correction within that time frame all but one time.
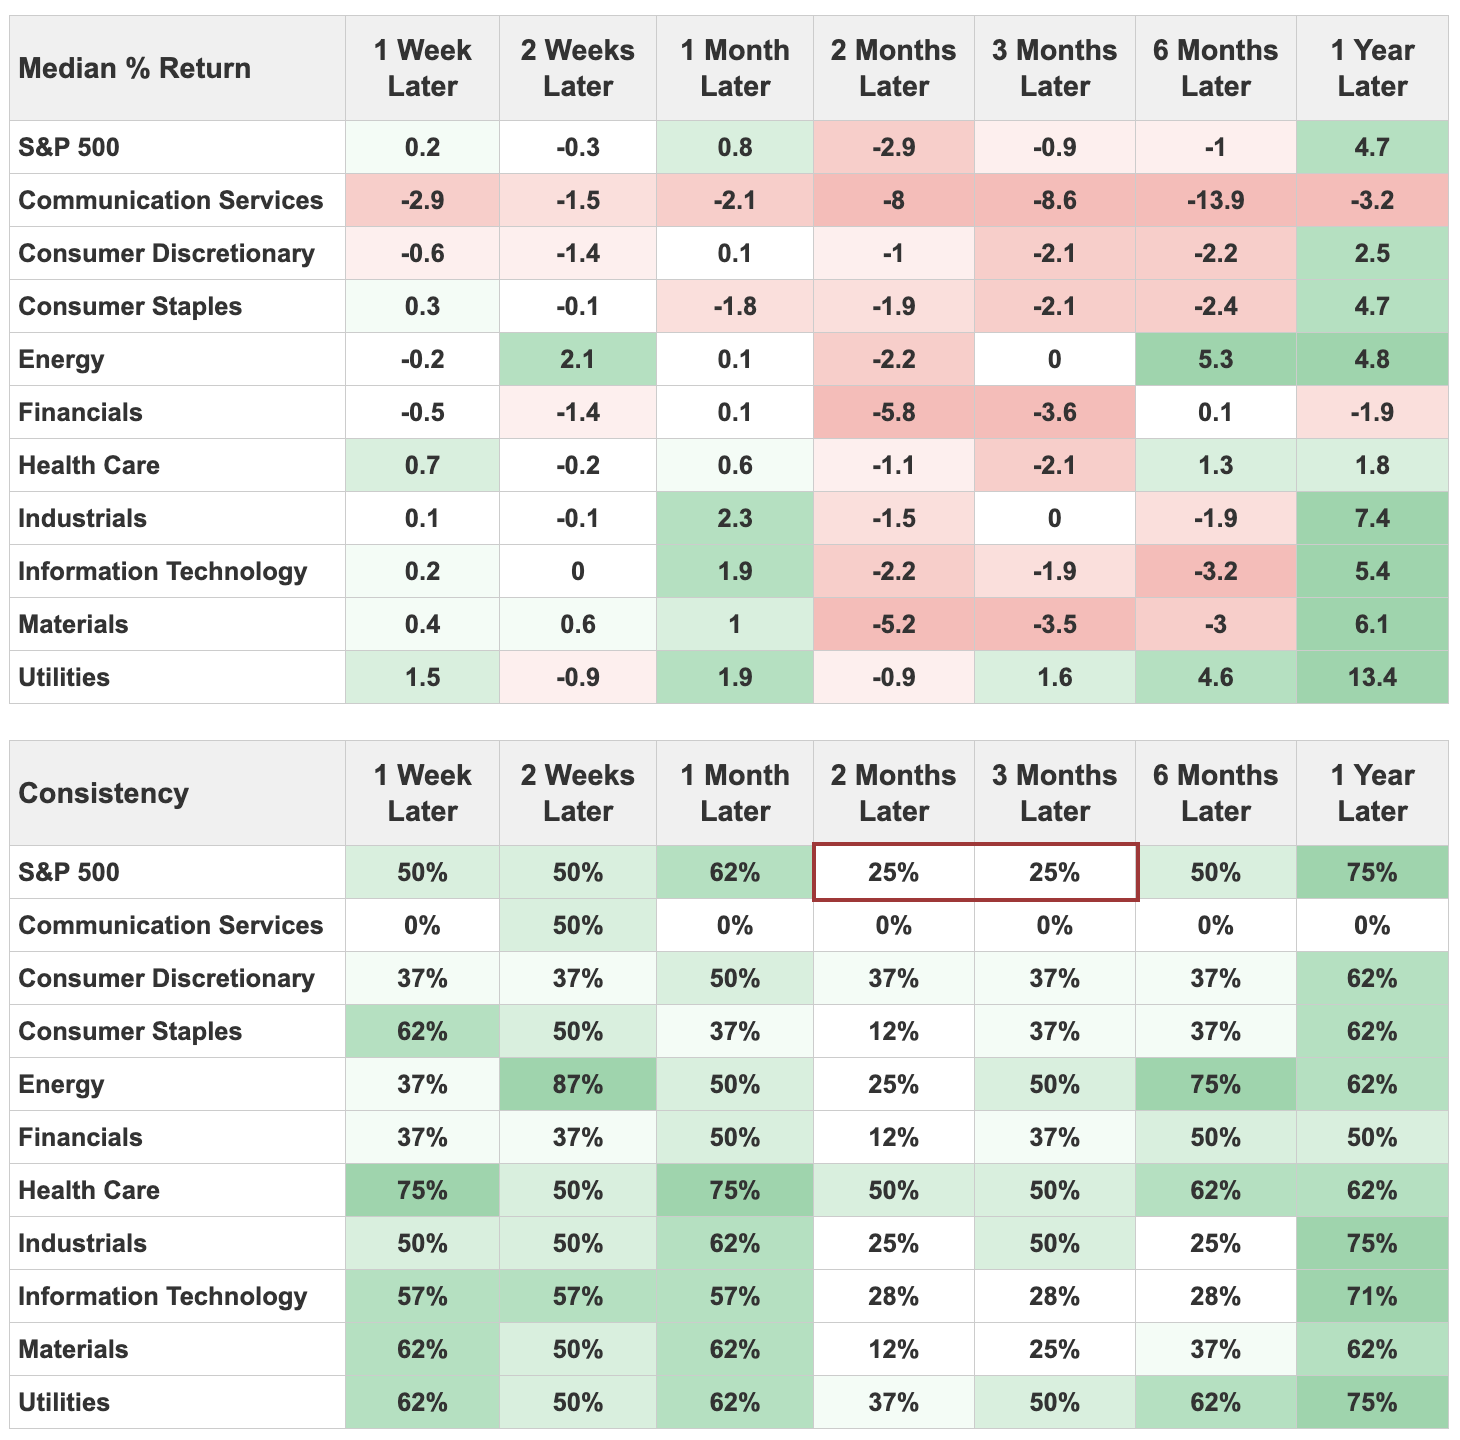
If we click the Major Sectors tab of the backtest results, we can see that these signals in SMH tended to be negative for the S&P 500, as well. Two months later, the S&P averaged a return of -2.9% and was positive 25% of the time. There was a lot of red across sectors over the medium term.
Broadening the time horizon
Semiconductor ETFs don't have much history, so we can use the S&P 1500 semiconductor industry to get as long a history as possible. This index's daily returns have a 97% correlation to SMH and a 96% correlation to SOXX.
Below, we can see every time the S&P 500 reached a record high. At the same time, semis had been at a new high within the past 30 sessions but were now down at least -8% from that high.
This proved to be a problem a handful of times, though the lead time varied greatly. The last two occurrences were in 1999 and 2021, which should send a shiver down the backs of any equity investor. While stocks levitated for a while, those gains were more than wiped out in the year(s) ahead. It also proved to be a problem ahead of the 1994 recession, the 1987 market crash, and meandering markets in 1959 and 1983. It had no ill effects in the mid-1990s.
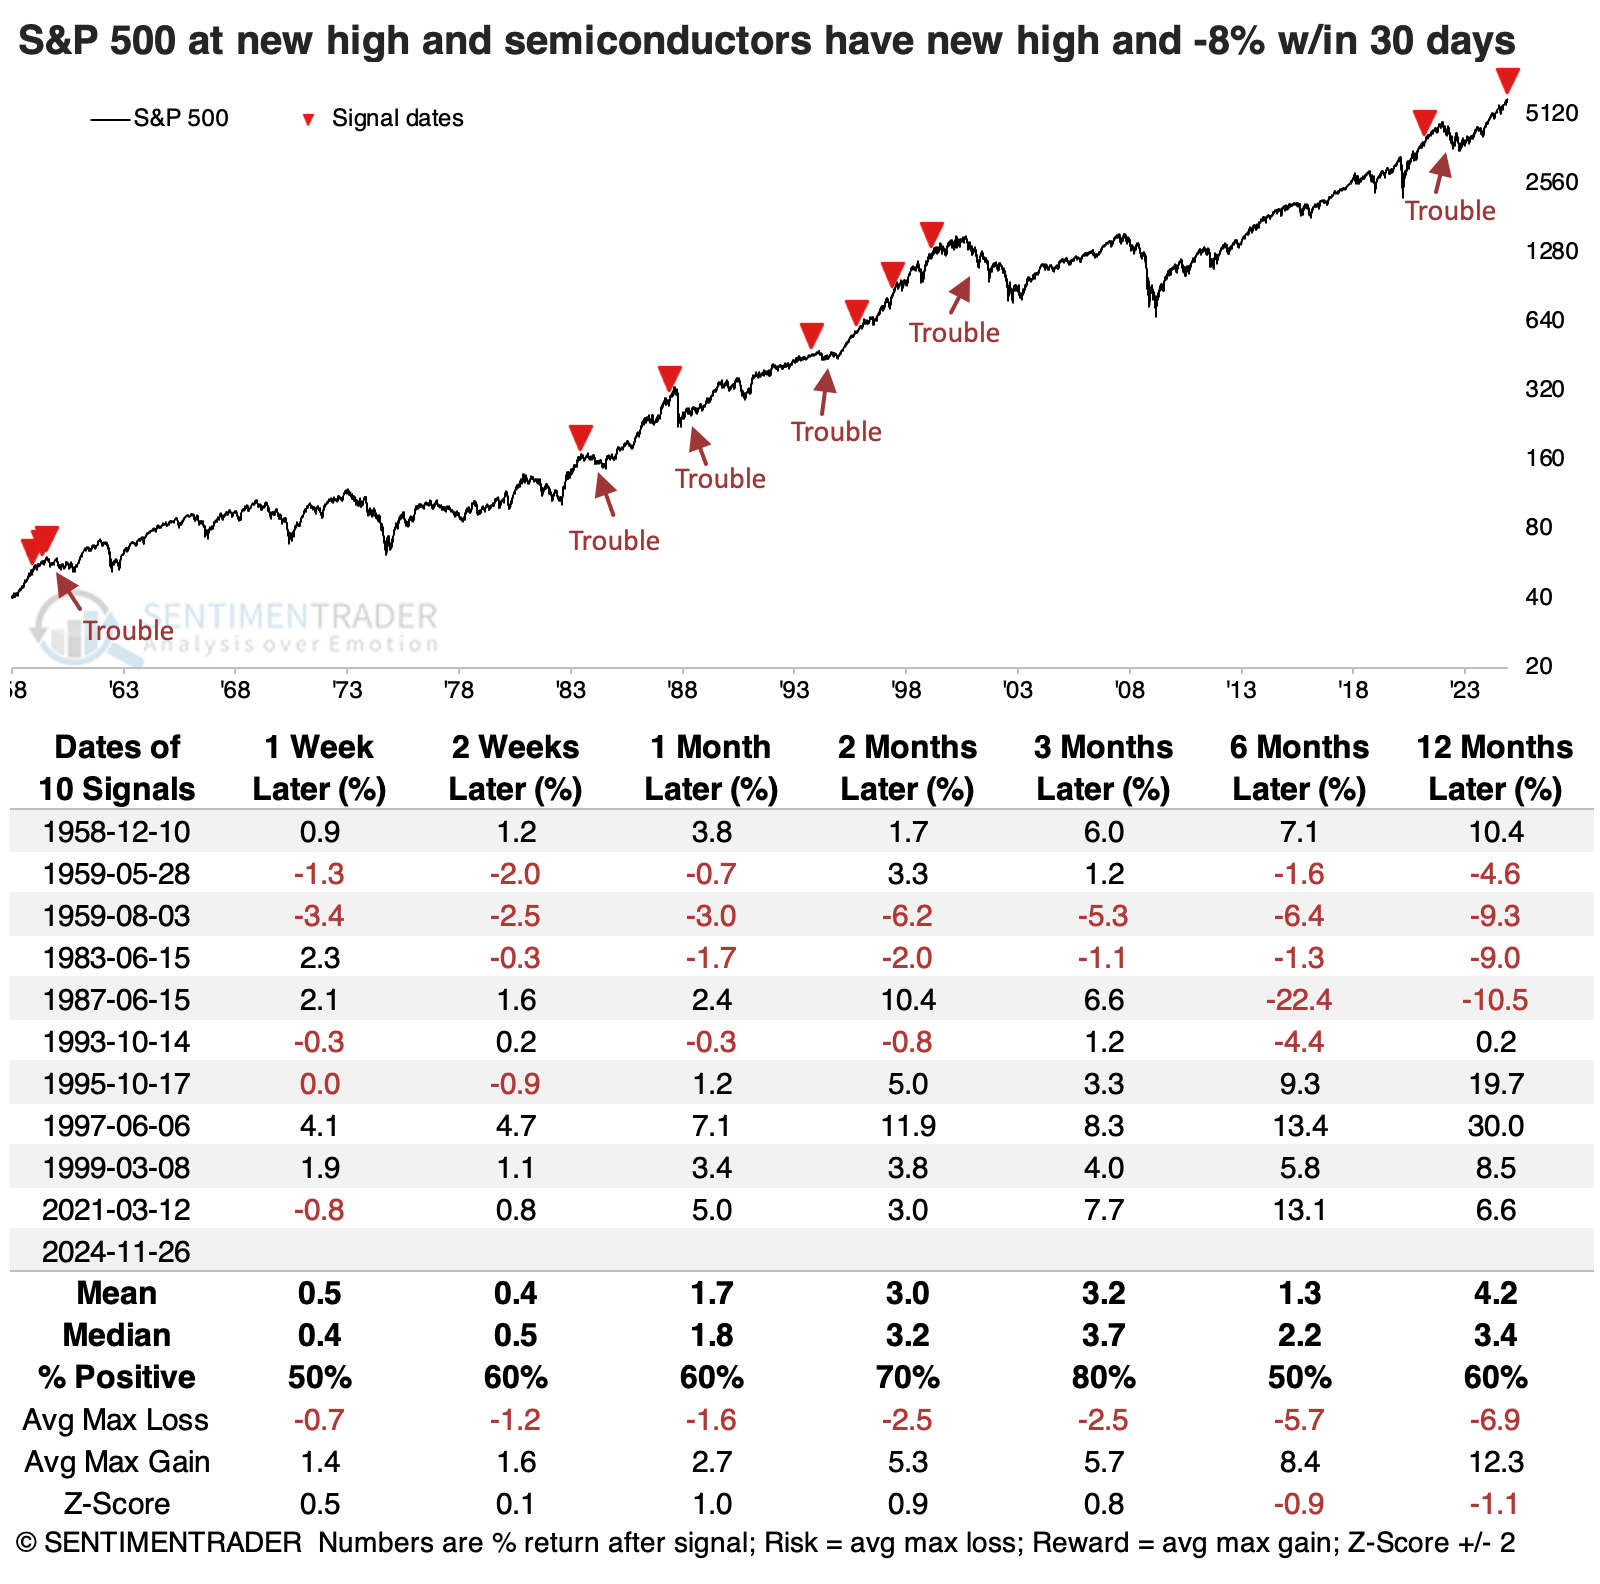
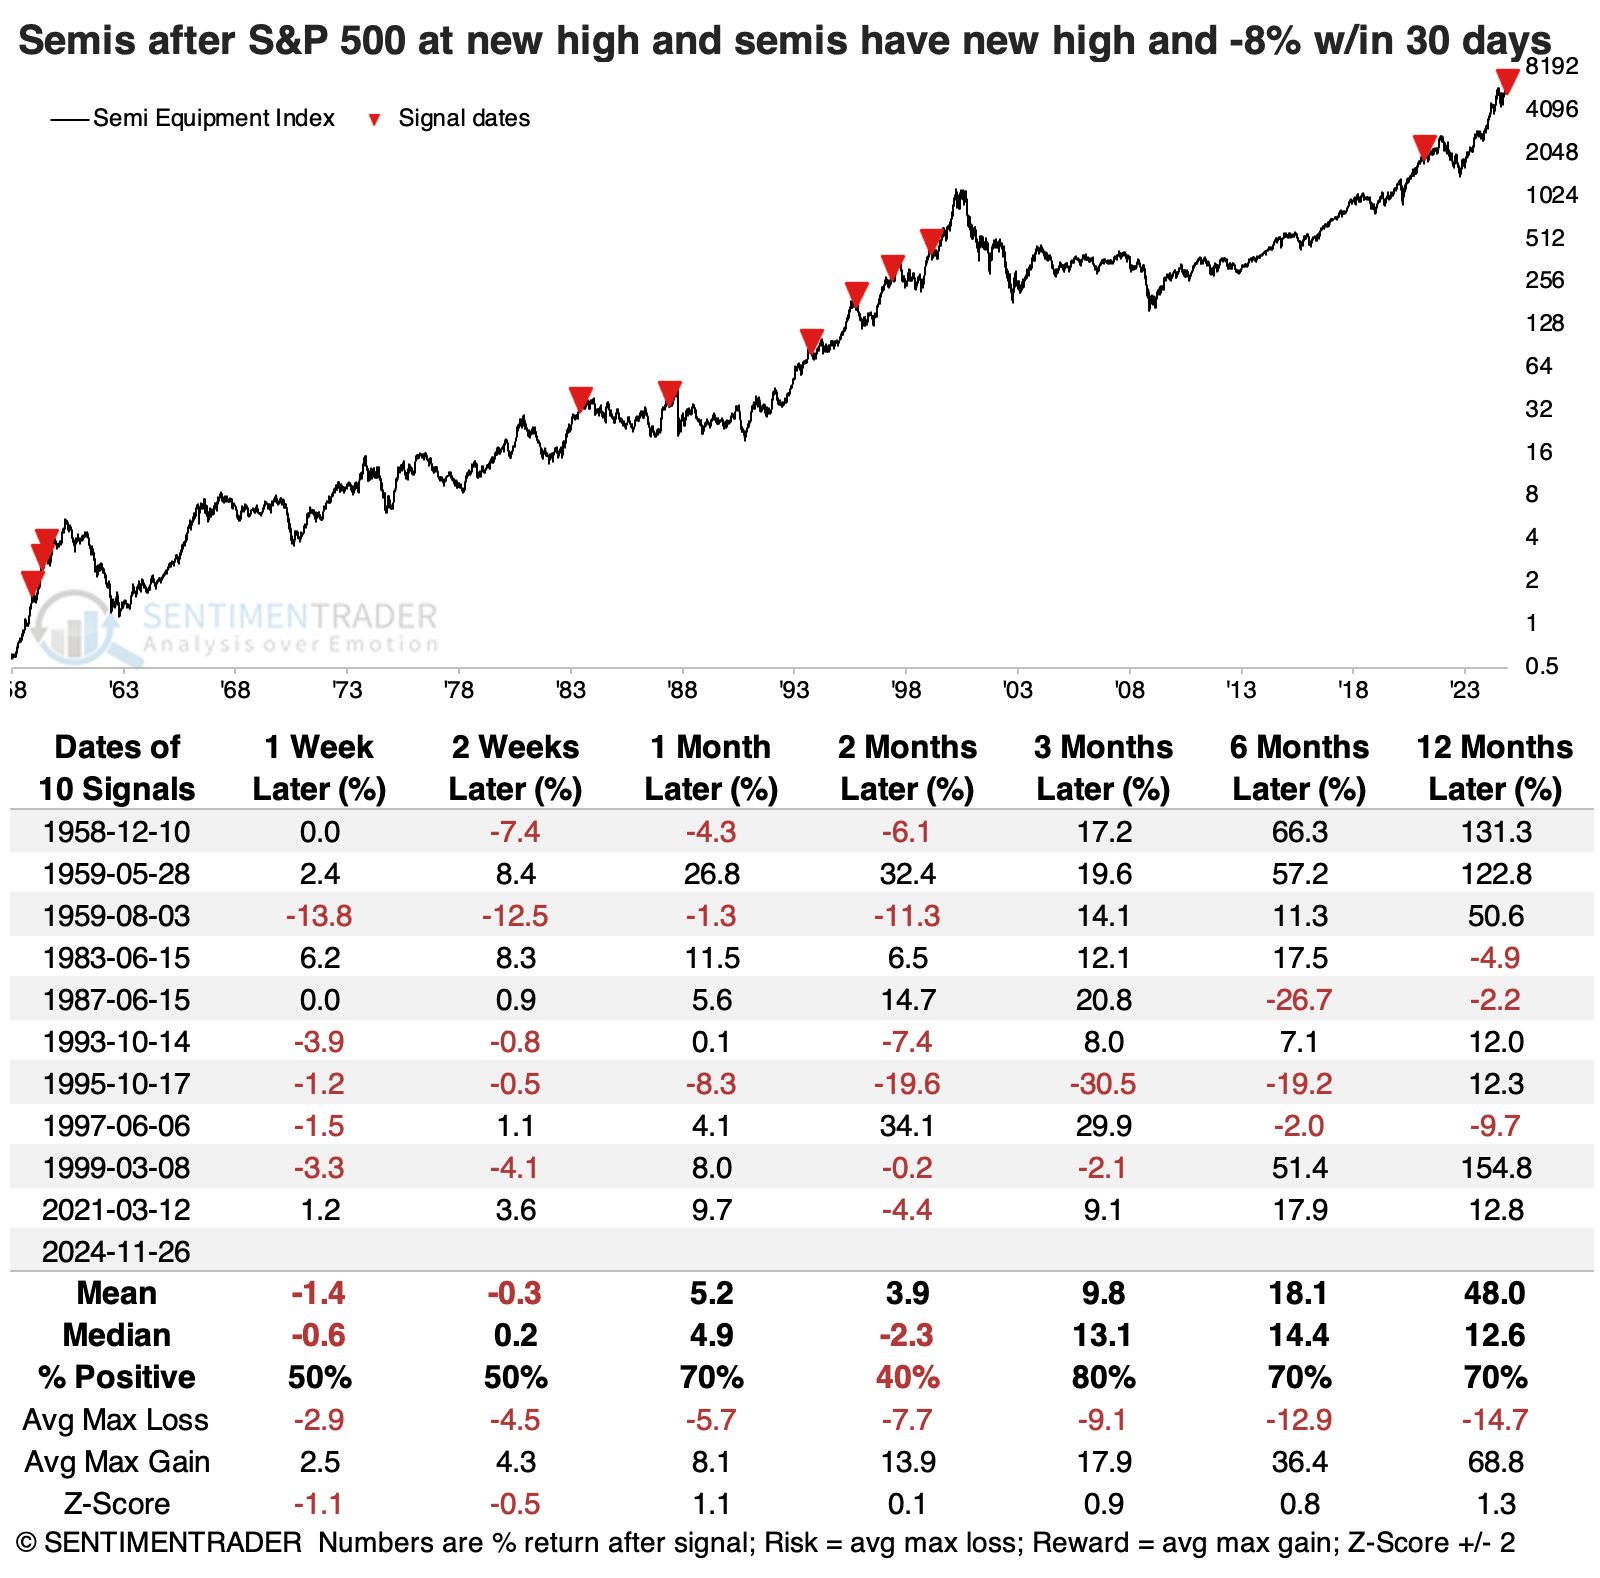
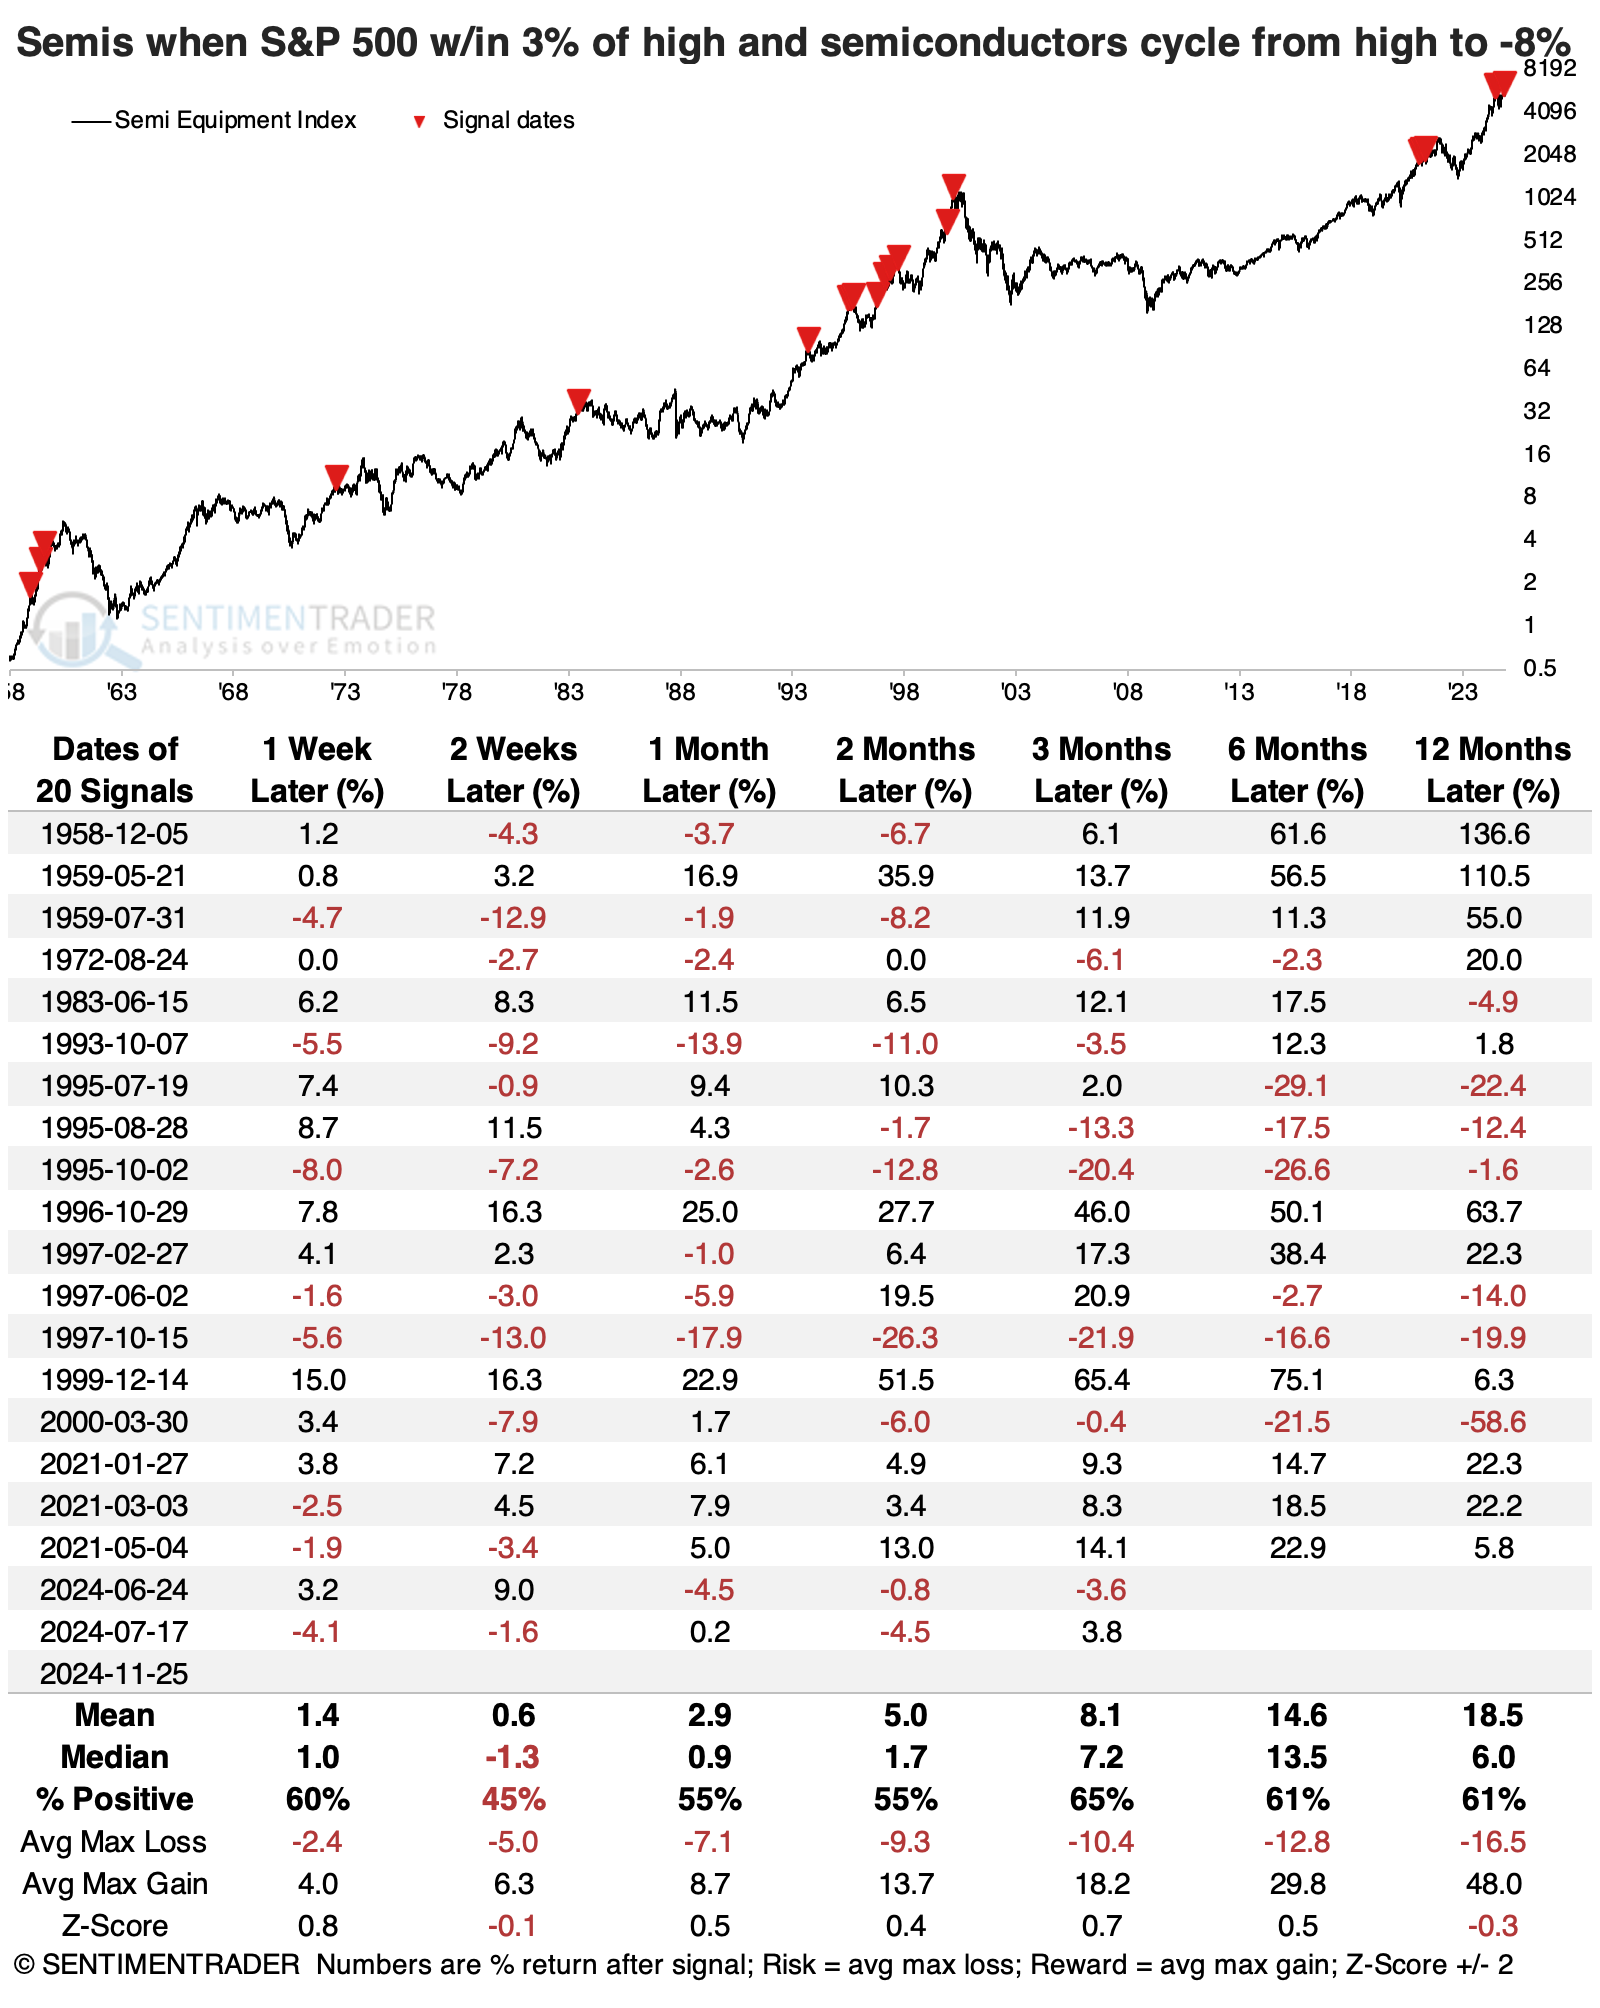
For semis, these signals proved to be a wild ride. Returns were all over the place, with no consistent theme across any time frame. Over the next two months, there were more losses than gains but also a few double-digit gains. Over the following 3-12 months, however, the overall trend was higher as the sector made up for lost ground against the broader market.
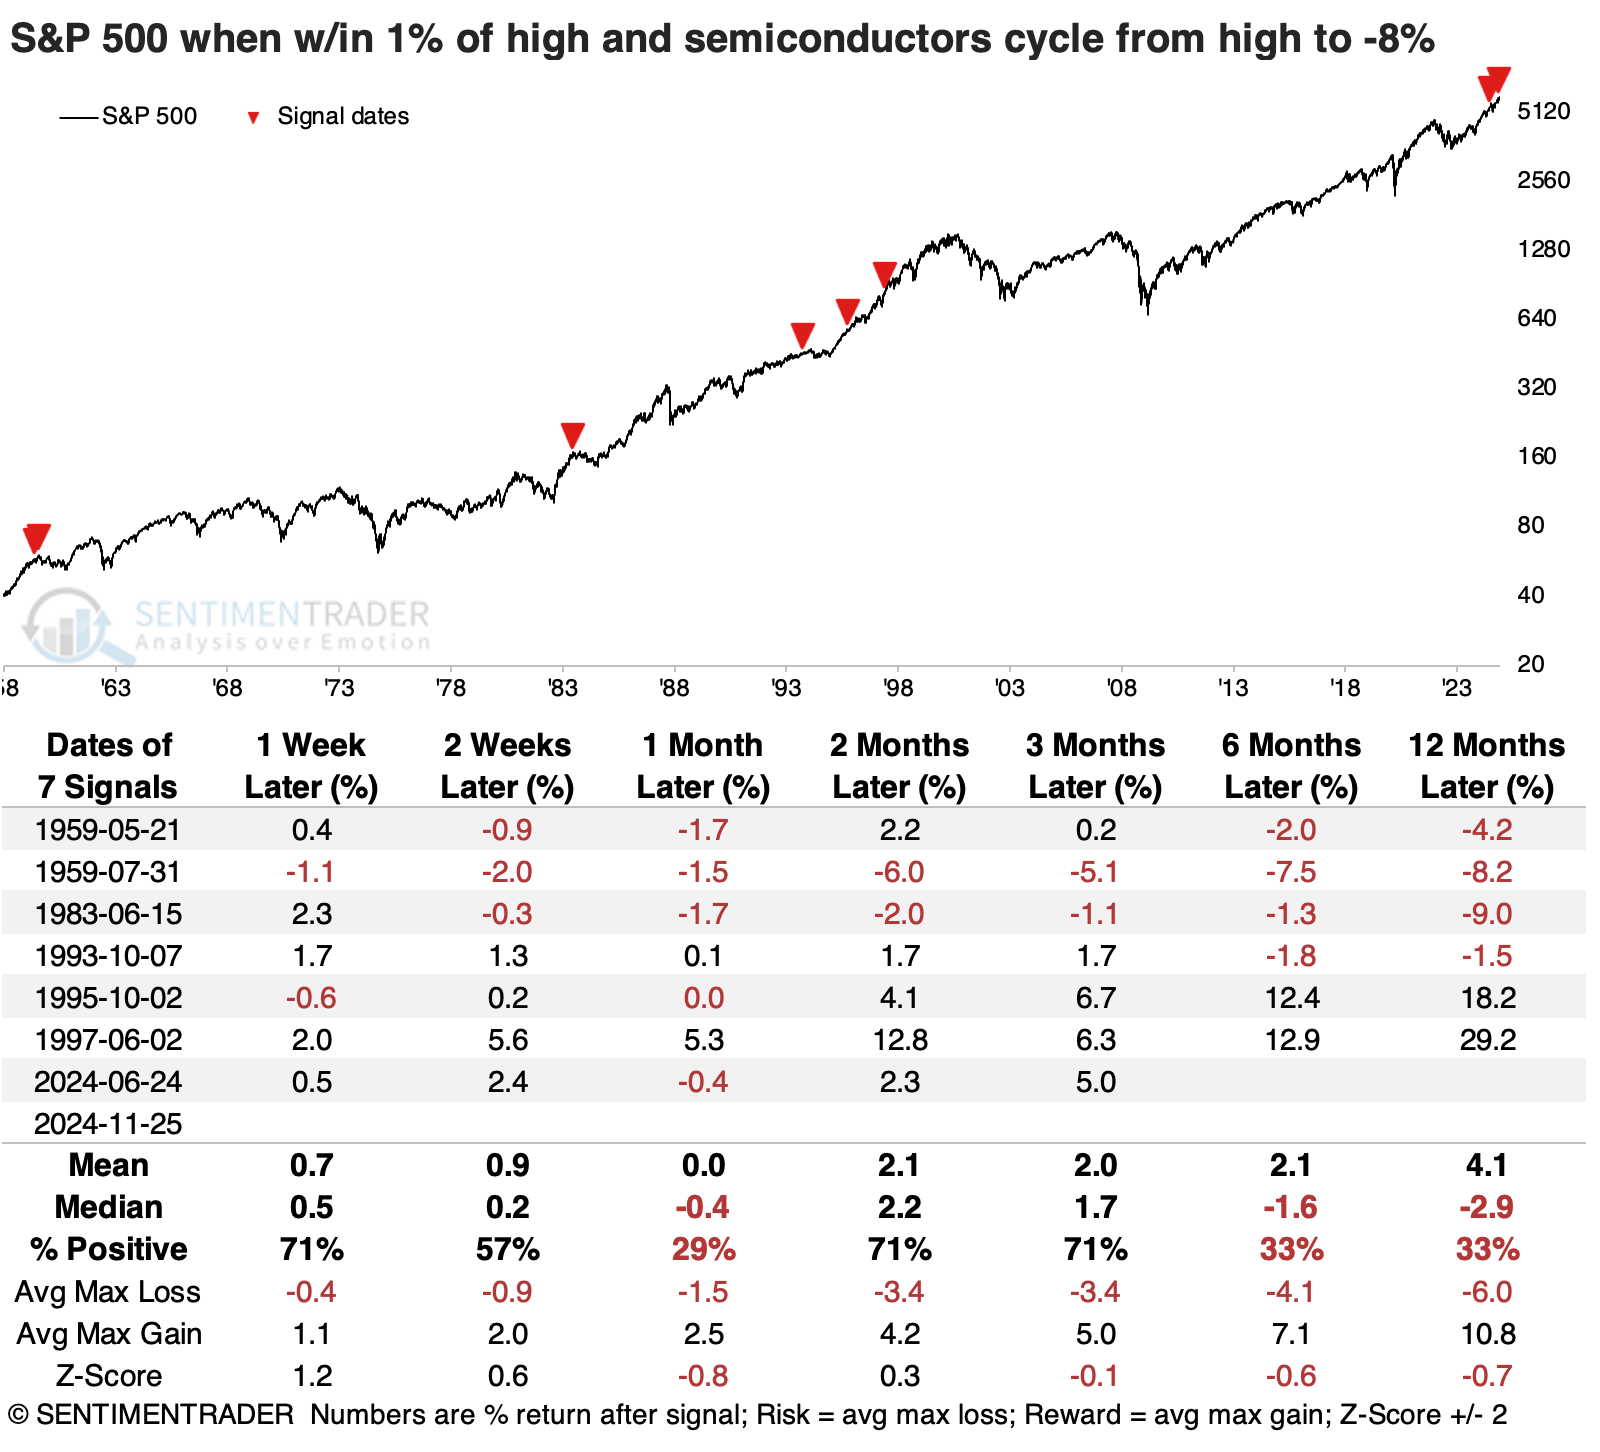
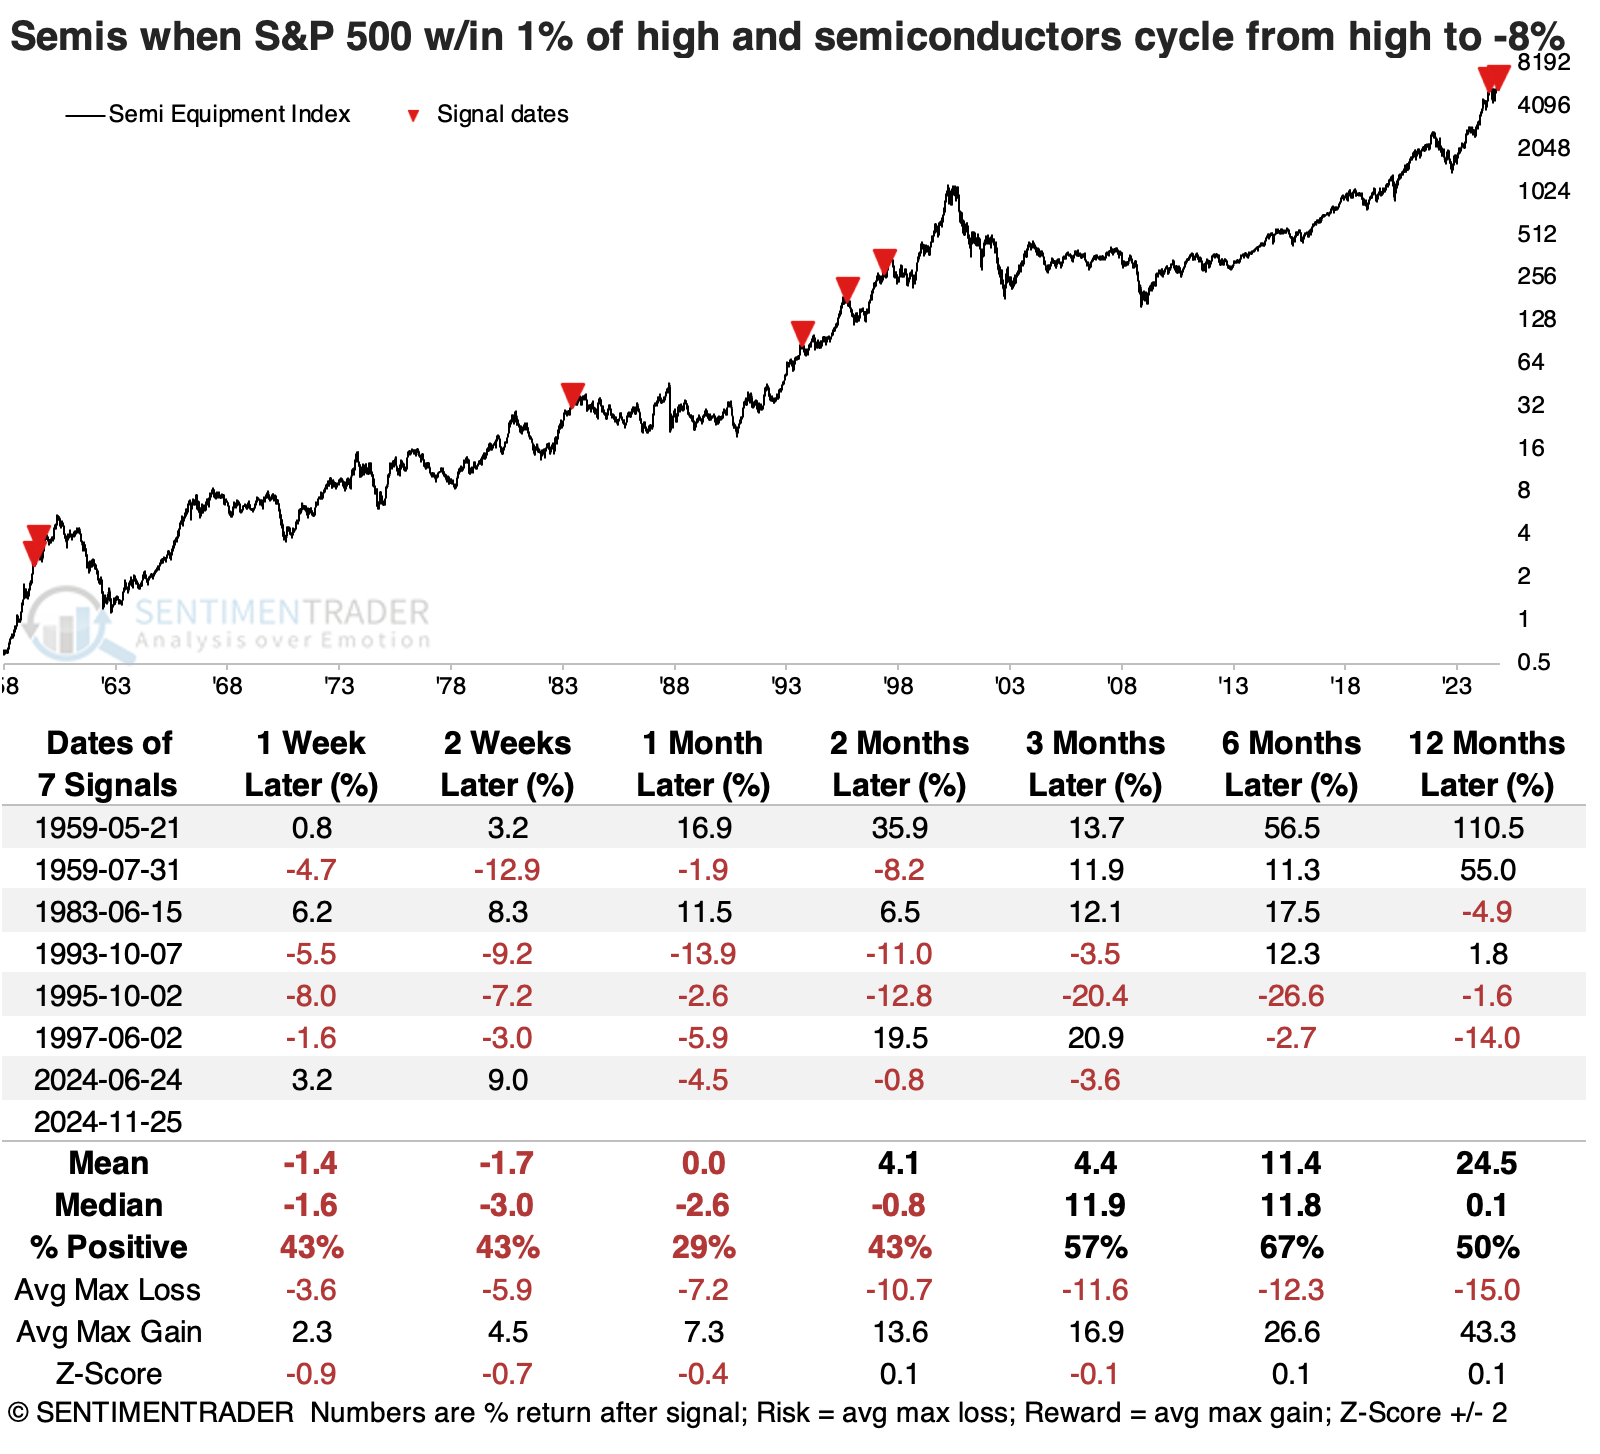
Let's take another tack. The table below shows times when semis cycled specifically from a new high to at least a -8% drawdown, and when it reached that drawdown level, the S&P 500 was within 1% of its own high. These triggered fewer signals and were generally worse for the S&P, though the mid-1990s signals preceded large and sustained gains.
For semis, these were worse for returns in the short term, with two winners out of seven attempts during the following month.
If we expand the sample size by allowing the S&P 500 to be within 3% of its high instead of 1%, then returns improve significantly. While the overall gist of things was not positive, it doesn't show in the returns in the table because the trouble showed up at different points. There was the issue of the mid-1990s when these signals had absolutely zero ill impact on the stock market.
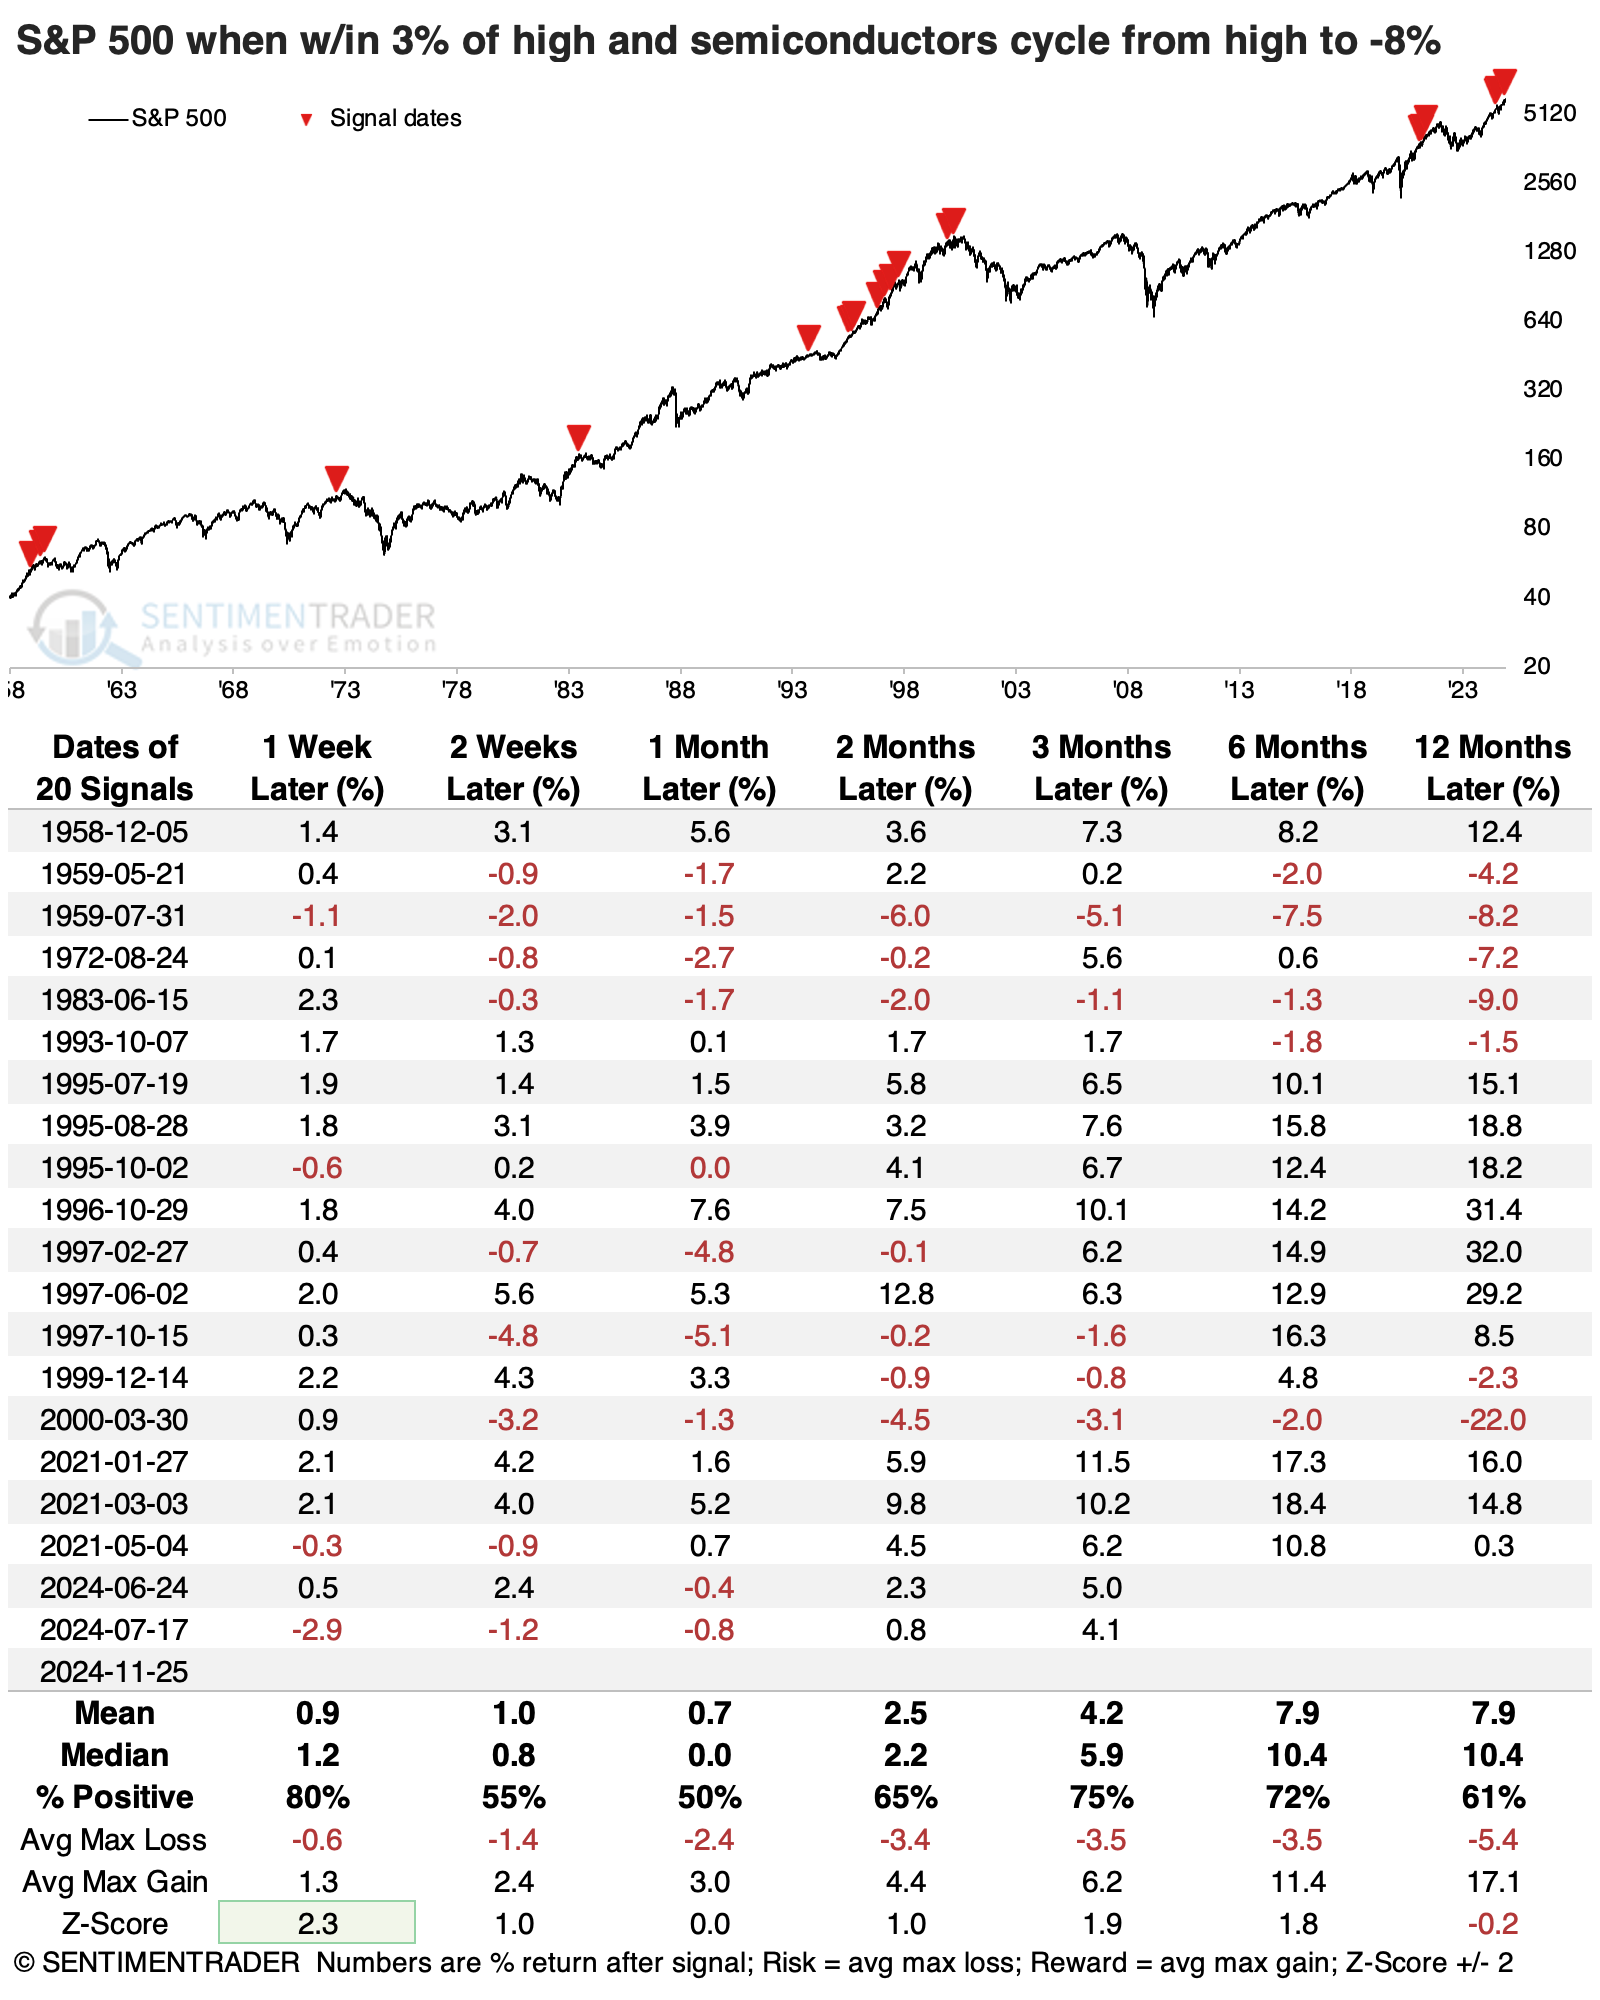
The signals weren't a great sign for semis, but they were also not consistently negative across time frames.
What the research tells us...
The history of semiconductors being able to replace the transportation sector as a harbinger of economic activity is questionable. The theory makes sense, but empirically, the evidence isn't clear-cut. There is a decent hint that weakness in semis is a bad omen for the broader stock market, but the lead times have varied greatly, making it less useful as a signal.
The most compelling aspect of the weakness in the sector is a preponderance of the evidence of relative weakness against the S&P. The sector has cycled from a leader to a laggard, which has not been a good sign for stocks over the past 25 years. While this butts up against positive seasonal trends, the most consistent weakness after signals like this was over the next two to three months.