Products
SentimenTrader Trading Tools
‍
Backtest Engine
My Trading Toolkit
Correlation Analysis
Seasonality
Indicators & Data API
‍
Proprietary Indicators & Charts
Market Data API
Strategies & Scanner
‍
50+ Trading Strategies
Smart Stock Scanner
Research Reports
‍
Research Solutions
Reports Library
Free Resources
Simple Backtest Calculator
Simple Seasonality Calculator
The Kelly Criterion Calculator
Sentiment Geo Map
Public Research Reports
Pricing
Company
About
In the News
Testimonials
Client Success Stories
Contact
Log inLoginSign up
< BACK TO ALL REPORTS

The probability of a commodity super cycle

Jason Goepfert
2021-03-23
Over the past year, all major commodities have gained, with a median return that's near the highest ever.

It's been a heckuva run for most assets in recent months, even formerly left-for-dead ones like commodities.

More and more, there are calls that we're in the beginning of a commodity super-cycle, those multi-year cycles when broad baskets of things that people pull out of the ground actually rise in price.

The gains in commodity contracts over the past years have been spectacular, with a median return of more than 50%. That's on the cusp of challenging the best run in 40 years, with the only comparable thrust coming out of the financial crisis in 2009. 

Median year over year return in commodities

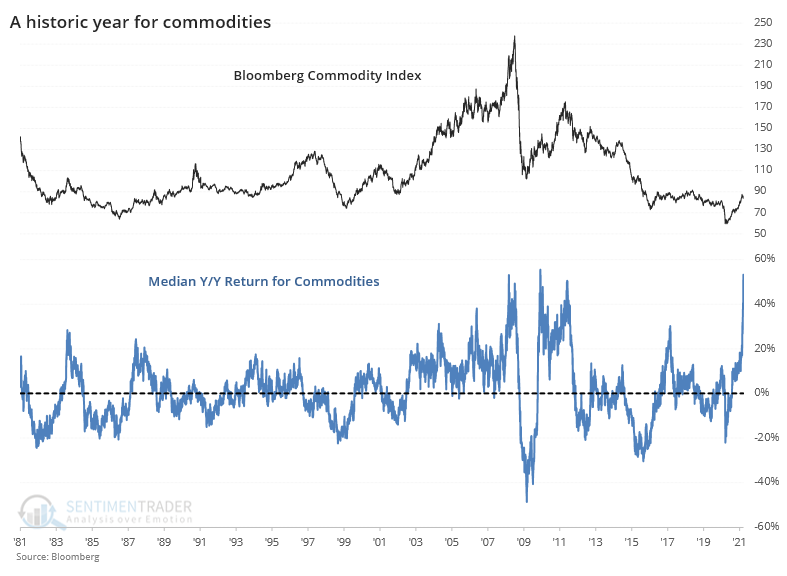
If we focus on the breadth of the price increases among commodity contracts, then we can look at other times when a majority of them were showing gains and see if it suggested a high probability that it was a new super cycle.

The conclusion, based on 11 other signals since 1980, was that it was a tough slog ahead for commodities bulls.

What else we're looking at

  • Full returns in a commodity index after 80% or more of contracts showed a year-over-year gain
  • Forward returns in the S&P 500 and individual commodity contracts, too
  • What it means when most S&P 500 stocks are outperforming the index, like they're doing now
  • What might happen if bonds don't bounce

Stat Box

Despite a gain of more than 0.70% on the S&P 500 on Monday, less than 39% of NYSE volume flowed into advancing stocks. This is one of the lowest figures since 1928.


Etcetera

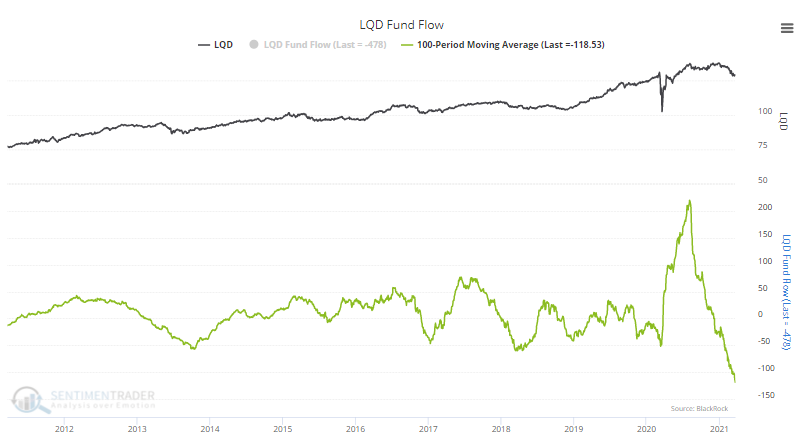
Nobody wants bonds. Over the past 100 days, the LQD corporate bond fund has seen an outflow averaging more than $100 million per day. That's the largest average outflow in its history, reversing much of the inflow from mid-2020.

lqd fund flow

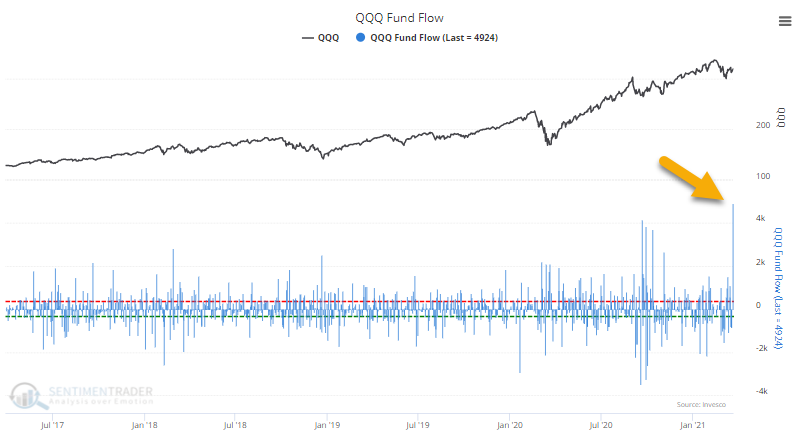
They do want tech. The Nasdaq 100 fund, QQQ, saw an massive inflow on Monday. At nearly $5 billion, it's the largest single-day inflow in that fund's history.

qqq fund flow

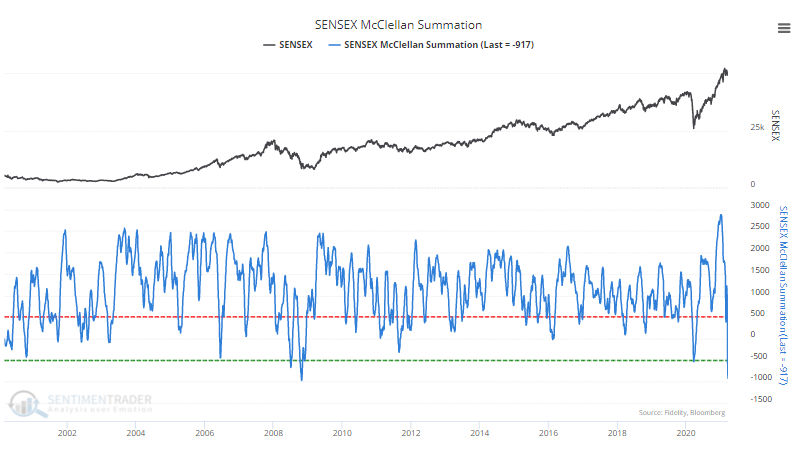
Historic selling in Indian stocks. Within the SENSEX index, there has been enough internal selling pressure that the McClellan Summation Index has plunged to the 2nd-lowest reading in 20 years. Only the depths of the financial crisis saw a lower reading.

india sensex mcclellan summation index

PRODUCTS
SentimenTrader
Trading Tools
Indicators & Data API
‍
Strategies & Scanner
‍
Research Reports
FREE
RESOUrCES
Simple Backtest
Calculator
Simple Seasonality
Calculator
The Kelly Criterion
Calculator
Sentiment Geo Map
‍
Public Research Reports
‍
Pricing
Bundle pricing
‍
Announcements
‍
FAQ
COMPANY
‍
About
‍
In the News
‍
Testimonials
‍
Client Success Stories
CONTACT
‍
General Inquiries
‍
Media Inquiries
‍
Financial Professionals Inquiries
‍
© 2025 Sundial Capital Research Inc. All rights reserved.
Setsail Marketing
TermsPrivacyAffiliate Program
Risk Disclosure: Futures and forex trading contains substantial risk and is not for every investor. An investor could potentially lose all or more than the initial investment. Risk capital is money that can be lost without jeopardizing ones’ financial security or life style. Only risk capital should be used for trading and only those with sufficient risk capital should consider trading. Past performance is not necessarily indicative of future results.

Hypothetical Performance Disclosure: Hypothetical performance results have many inherent limitations, some of which are described below. No representation is being made that any account will or is likely to achieve profits or losses similar to those shown; in fact, there are frequently sharp differences between hypothetical performance results and the actual results subsequently achieved by any particular trading program. One of the limitations of hypothetical performance results is that they are generally prepared with the benefit of hindsight. In addition, hypothetical trading does not involve financial risk, and no hypothetical trading record can completely account for the impact of financial risk of actual trading. for example, the ability to withstand losses or to adhere to a particular trading program in spite of trading losses are material points which can also adversely affect actual trading results. There are numerous other factors related to the markets in general or to the implementation of any specific trading program which cannot be fully accounted for in the preparation of hypothetical performance results and all which can adversely affect trading results.

Testimonial Disclosure: Testimonials appearing on this website may not be representative of other clients or customers and is not a guarantee of future performance or success.