
The Potential Fly in the Ointment for Regional Banks

Key Points
- The Regional Banks sector recently rallied to its highest level in four years
- However, Regional banks tend to be highly cyclical in nature
- Seasonality suggests that investors exercise some patience before jumping into this sector, and look for better opportunities elsewhere in the months ahead
Regional banks are looking good...
No one can complain too loudly about the performance of regional banks lately. In the chart below, we see the price action S&P 500 Regional Banking Sector ETF (KRE).
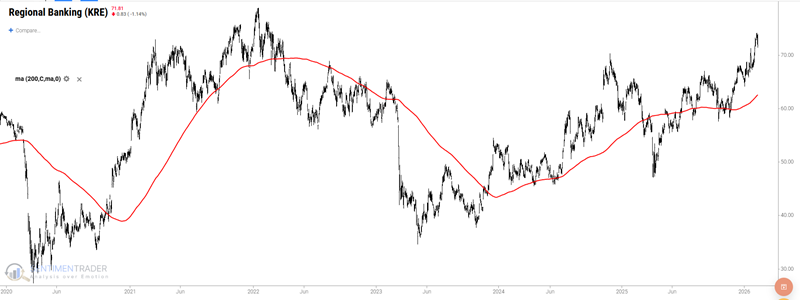
After bottoming out in May 2023, the price has been steadily working its way higher. Now solidly above its 200-day moving average, the ETF recently broke out above a two-year high and now appears to be setting its sights on the all-time high established in January 2022.
One would have to be an extreme contrarian to bet on the short side of regional banks at the moment. However, there may be a reason to hold off on betting heavily on regional banks at the moment.
... but Seasonality could be the fly in the ointment
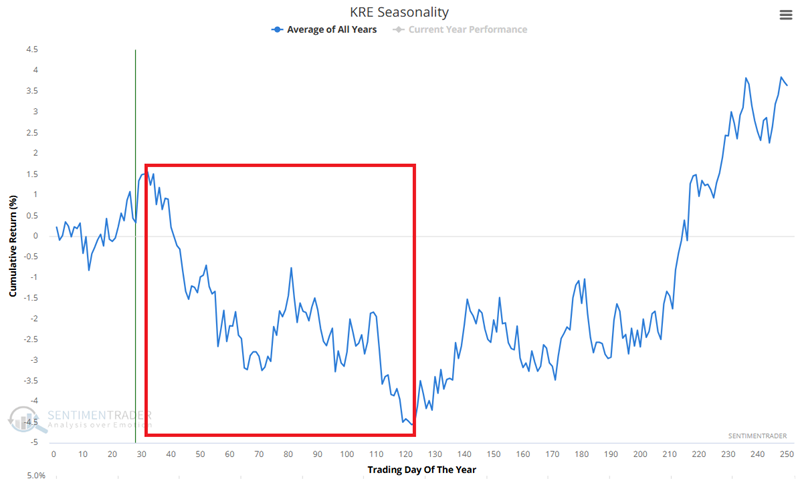
The regional banks sector has shown itself to be a highly cyclical performer. The chart below displays the Annual Seasonal Trend for ticker KRE. It also highlights the period extending from Trading Day of the Year (TDY) #32 through TDY #71. For 2026, this period extends from the close on February 18th through April 15th.
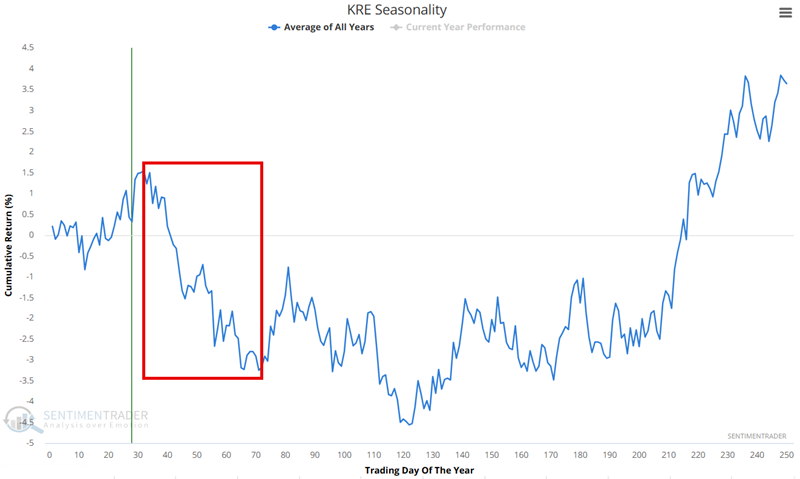
We will highlight KRE performance during this period in a moment. For now, let's make an important distinction. The argument being made here:
- IS NOT that investors should place a heavy bet on the short side regarding regional banks
- IS that investors may be better off looking for other places to allocate capital
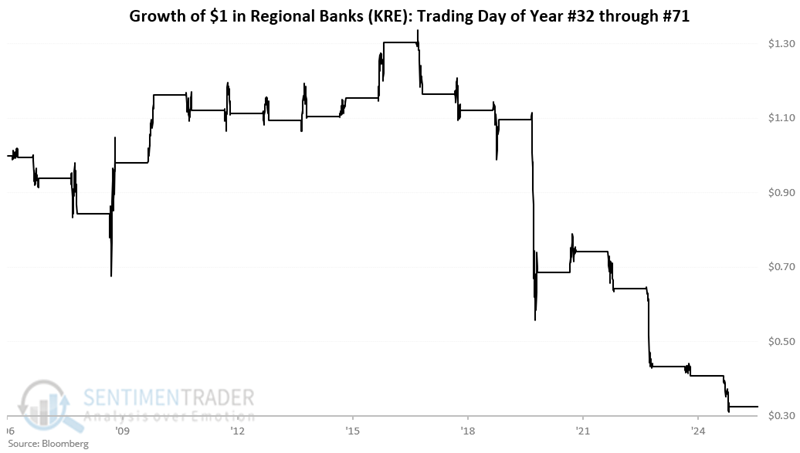
If we take a closer look at the seasonal pattern for KRE, we can note that weakness tends to persist through mid-year. The chart below displays the hypothetical growth of $1 invested in ticker KRE during the TDY #32 through TDY #71 period every year since KRE started trading in 2006.
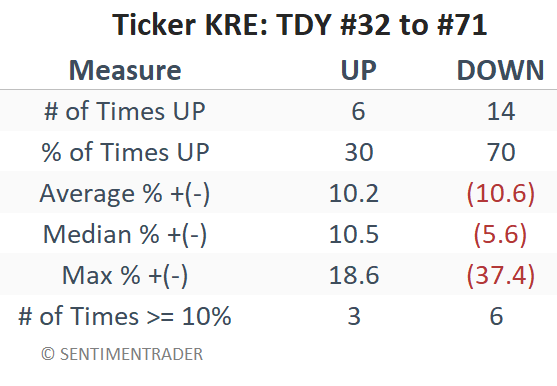
 The table below summarizes the yearly results shown above.
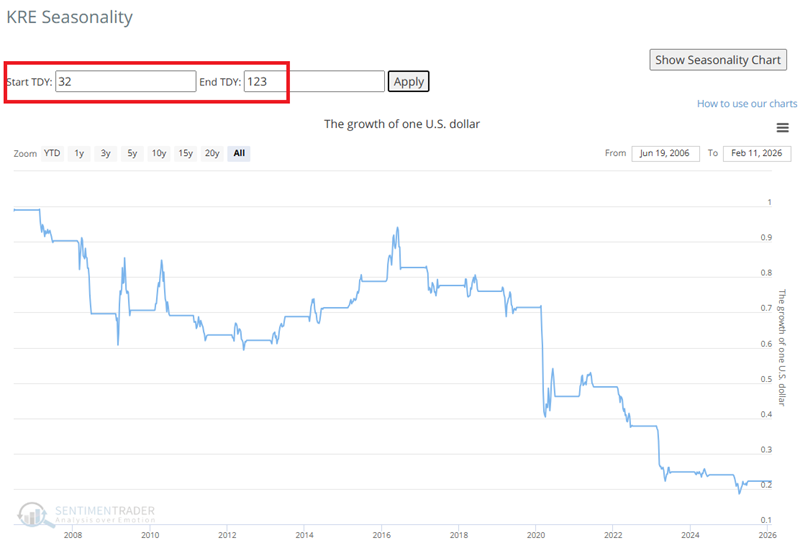
Note further that weakness in regional banks tends to persist through mid-year. The chart below highlights the TDY #32 to TDY #123 period for ticker KRE.
The chart below shows the hypothetical growth of $1 invested in KRE only during the TDY #32-TDY #123 period. While KRE clearly can show a gain during this period in any given year, the charts above and below offer a strong argument for steering clear.
What the research tells us…
To repeat, given the positive price action in KRE, the crux of this note is not an effort to compel someone to play the short side of regional banks (although that is an option for aggressive short-term traders). The argument made here is simply that - at least for the next several months - investors may find better opportunities elsewhere.