Products
SentimenTrader Trading Tools
‍
Backtest Engine
My Trading Toolkit
Correlation Analysis
Seasonality
Indicators & Data API
‍
Proprietary Indicators & Charts
Market Data API
Strategies & Scanner
‍
50+ Trading Strategies
Smart Stock Scanner
Research Reports
‍
Research Solutions
Reports Library
Free Resources
Simple Backtest Calculator
Simple Seasonality Calculator
The Kelly Criterion Calculator
Sentiment Geo Map
Public Research Reports
Pricing
Company
About
In the News
Testimonials
Client Success Stories
Contact
Log inLoginSign up
< BACK TO ALL REPORTS

The Post-Election Year 'Dead Zone'

Jay Kaeppel
2021-07-29
The major stock market indexes have enjoyed steady gain and extremely little downside volatility so far in 2021. Still, some well-established post-election year history suggests the market tends to struggle during the months directly ahead. In this piece, we detail that history to help investors set their own expectations.

With August looming, it would seem to be a good time to highlight what I refer to as the Post-Election Year "Dead Zone." You've heard of the "Dog Days of Summer?" Well, welcome to them.

AUGUST THROUGH OCTOBER OF POST-ELECTION YEARS

The chart below displays the cumulative % price change for the S&P 500 Index if held long ONLY during:

  • August, September, and October
  • Of each post-presidential election year starting in 1929

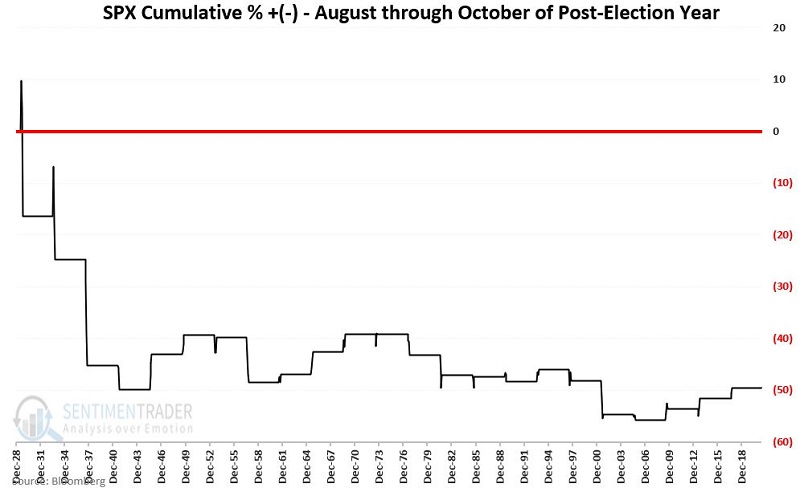
The net result is a cumulative decline of -49.5%. It should be noted that the bulk of this decline took place in 1929, 1933, 1937, and 1941 - a period which some might reasonably argue was far different from the environment today or even in the post-WWII era.

But before dismissing the "Dead Zone" theory, also note that since 1941:

  • There have been 19 post-election years
  • The cumulative gain for the S&P 500 Index during Aug-Oct of these 19 years is +0.73%

It doesn't get much more "dead" than that.

CYCLE-BY-CYCLE

This 3-month period within each 4-year election cycle has shown:

  • A gain 10 times
  • A loss 13 times
  • Average gain = +5.5%
  • Average loss = (-8.6%)
  • A gain exceeded 10% one time (+13.6% in 1945)
  • A loss exceeded -10% four times (Worst was -27.2% in 1937)

The table below displays the cumulative 3-month price change for the S&P 500 during each election cycle.

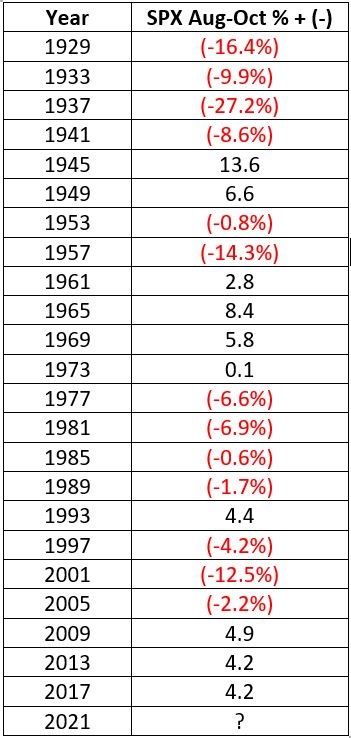
One last thing to note is that the last 3 post-election years (2009, 2013, and 2017) have all seen the S&P 500 advance over +4%.

So does this mean:

  • That the "curse" is broken?
  • Or that the "law of averages" is about to assert itself?

Sorry folks, we will have to wait and see how the story unfolds. But at the very least, we enter August with an awareness that - IF the major stock market indexes in 2021 are EVER going to experience anything less than "Peaches and Cream," this time period is a likely candidate for when that could happen.

Sorry, you don't have access to this report

Upgrade your subscription plan to get access
Go to Dasboard
PRODUCTS
SentimenTrader
Trading Tools
Indicators & Data API
‍
Strategies & Scanner
‍
Research Reports
FREE
RESOUrCES
Simple Backtest
Calculator
Simple Seasonality
Calculator
The Kelly Criterion
Calculator
Sentiment Geo Map
‍
Public Research Reports
‍
Pricing
Bundle pricing
‍
Announcements
‍
FAQ
COMPANY
‍
About
‍
In the News
‍
Testimonials
‍
Client Success Stories
CONTACT
‍
General Inquiries
‍
Media Inquiries
‍
Financial Professionals Inquiries
‍
© 2025 Sundial Capital Research Inc. All rights reserved.
Setsail Marketing
TermsPrivacyAffiliate Program
Risk Disclosure: Futures and forex trading contains substantial risk and is not for every investor. An investor could potentially lose all or more than the initial investment. Risk capital is money that can be lost without jeopardizing ones’ financial security or life style. Only risk capital should be used for trading and only those with sufficient risk capital should consider trading. Past performance is not necessarily indicative of future results.

Hypothetical Performance Disclosure: Hypothetical performance results have many inherent limitations, some of which are described below. No representation is being made that any account will or is likely to achieve profits or losses similar to those shown; in fact, there are frequently sharp differences between hypothetical performance results and the actual results subsequently achieved by any particular trading program. One of the limitations of hypothetical performance results is that they are generally prepared with the benefit of hindsight. In addition, hypothetical trading does not involve financial risk, and no hypothetical trading record can completely account for the impact of financial risk of actual trading. for example, the ability to withstand losses or to adhere to a particular trading program in spite of trading losses are material points which can also adversely affect actual trading results. There are numerous other factors related to the markets in general or to the implementation of any specific trading program which cannot be fully accounted for in the preparation of hypothetical performance results and all which can adversely affect trading results.

Testimonial Disclosure: Testimonials appearing on this website may not be representative of other clients or customers and is not a guarantee of future performance or success.