
The "Panic then Patience" Strategy

Key points
- Sentiment Cycle Panic is one of four Sentiment Cycle tools available at Sentimentrader
- Investors typically look for the market to bottom out - and for a potential buying opportunity - when panic reaches an extreme
- A lower-risk, higher-probability alternative may be to wait for panic to completely subside before jumping in
The overview
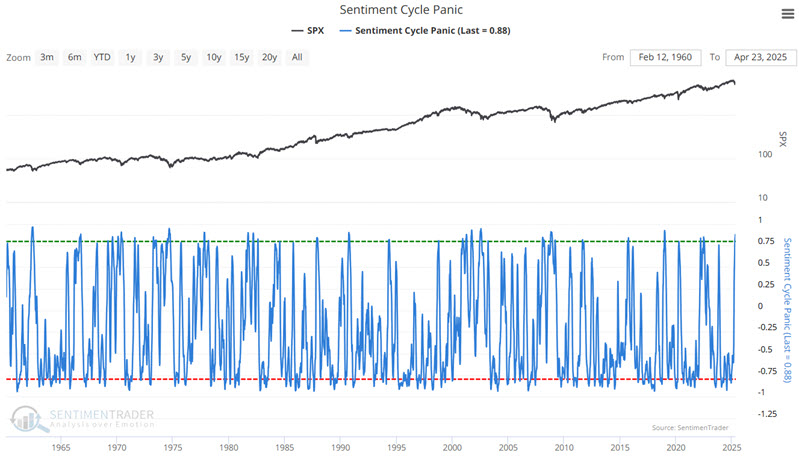
The Sentiment Cycle Panic indicator is one of four Sentiment Cycle tools available at Sentimentrader.
Human behavior is relatively constant, so many investors consider some version of the Typical Sentiment Cycle popularized by Justin Mamis in his 1999 book, The Nature of Risk. Instead of eyeballing a chart and guessing where we might be in the Cycle, we took the period from the Mamis book. Then we compared it to every similar Cycle since 1928 to develop an overall composite of what a Typical Sentiment Cycle has looked like over time. Each day, we use that composite and compare it to recent price action to see how correlated investor behavior is right now compared to other Cycles from the past. We take that information and calculate correlations for four different parts of the Cycle. The correlations range from -1.0 (perfect opposite) to +1.0 (perfect symmetry). In addition to a high correlation to a particular Cycle, investors should also look for behavior such as the following:
Enthusiasm: High optimism, easy credit, rush of offerings, risky stocks outperforming, stretched valuations.
Panic: Extreme pessimism, oversold breadth, risky stocks crash, negative media coverage, credit slams shut.
Discouragement: Stocks go nowhere, trend-followers suffer, there are some pockets of outperformance, credit starts to thaw, and activity slows.
Returning Confidence: Stocks rise choppily, smaller stocks do well, credit becomes easy, and more new offerings.
Testing subsiding panic as an "all-clear" signal
For this test, we first want to see a period of reasonable-sized panic. However, instead of rushing in during peak fear (when the market can be plunging lower, and since no one ever knows "how low is low"), we want to wait for panic to dissipate before acting. In other words, we are looking for an "all clear" signal.
To this end, we will apply the following rules:
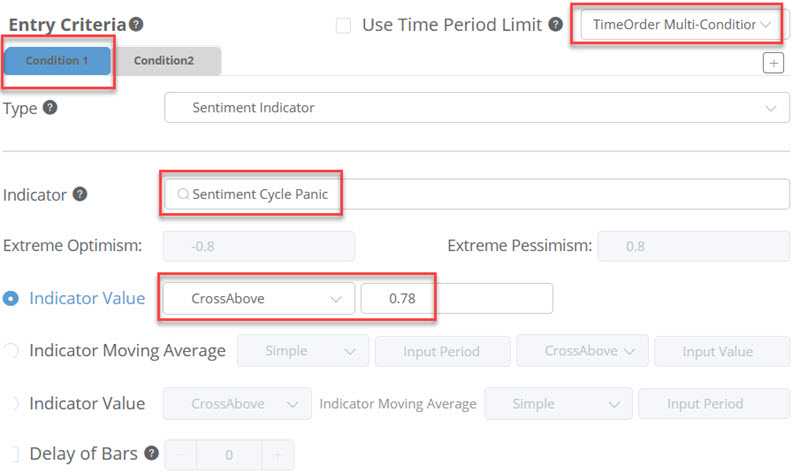
- Wait for Sentiment Cycle Panic to cross above 0.78
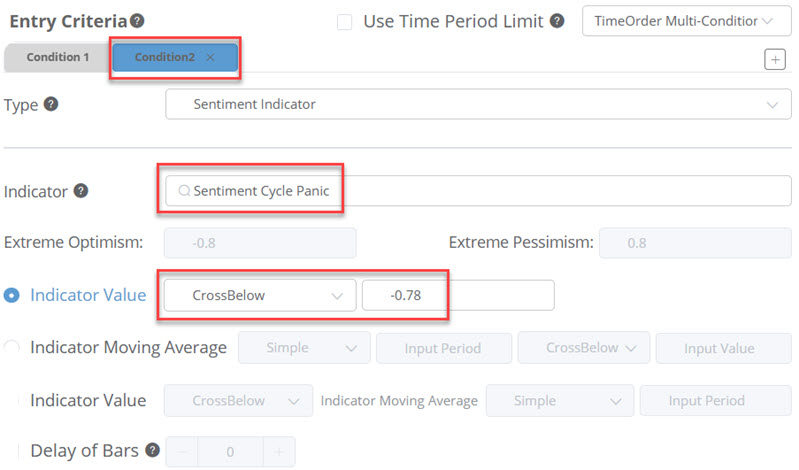
- Then wait for Sentiment Cycle Panic to cross back below (-0.78)
Once these rules are triggered, we will buy and hold the S&P 500 Index for nine months (or to be exact, 189 trading days).
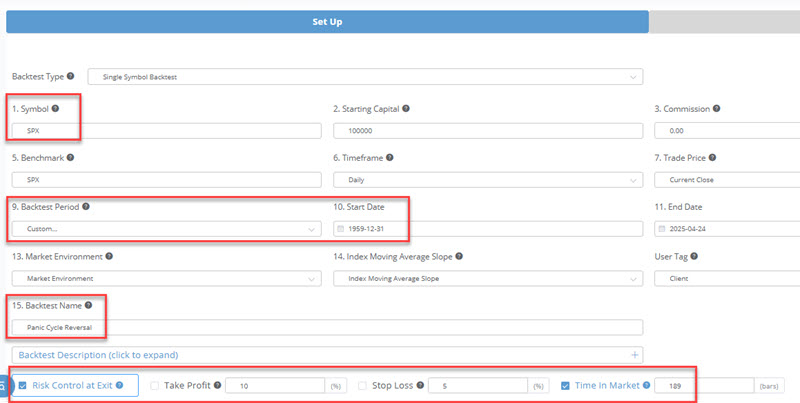
Setting up the test
We will set up the test in our Backtest Engine 2.0. The first Setup screen, which contains inputs, appears below. We set a start date of 1959-12-31 and our exit criteria at 189 days after a buy signal.
We are using a Time Order Multi-Condition entry. The screenshot below sets up the first criteria: Sentiment Cycle Panic must first Cross Above 0.78.
In the screen below, we set up the second criteria as Condition 2, i.e., Sentiment Cycle Panic must Cross Below -0.78,
Once the inputs are set, we can click Run Backtest to generate the test results.

Reviewing the results
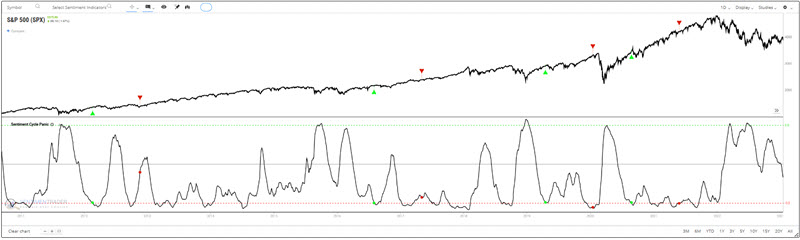
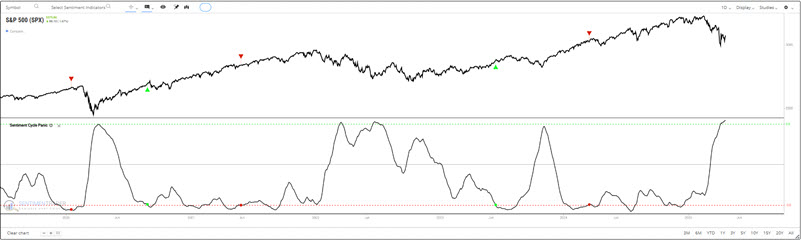
The screenshots below show market action and all trading signals based on these rules since 1960. Green arrows indicate entry signals, and red arrows indicate exit signals (which occur 189 trading days after a green arrow).
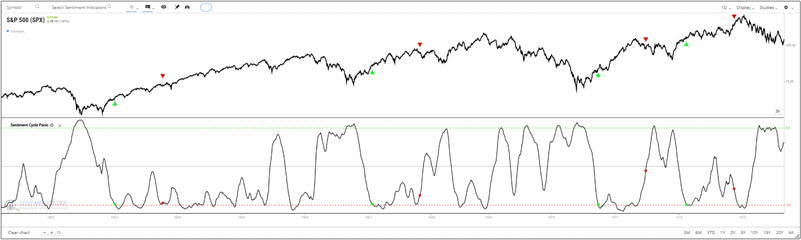
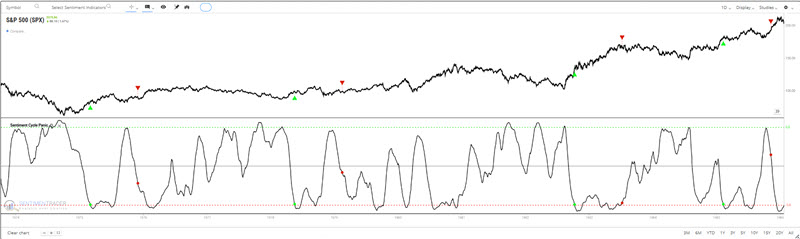
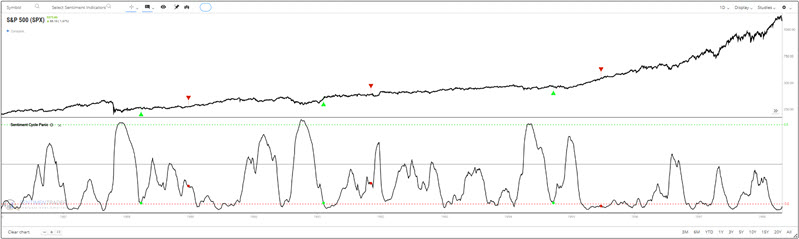
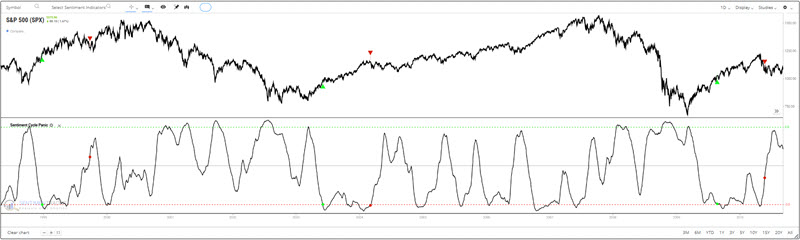
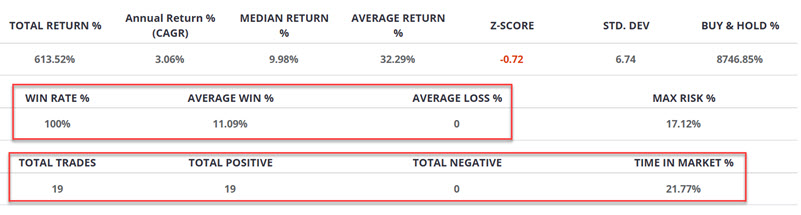
The table below summarizes the results from the signals generated.
Things to note:
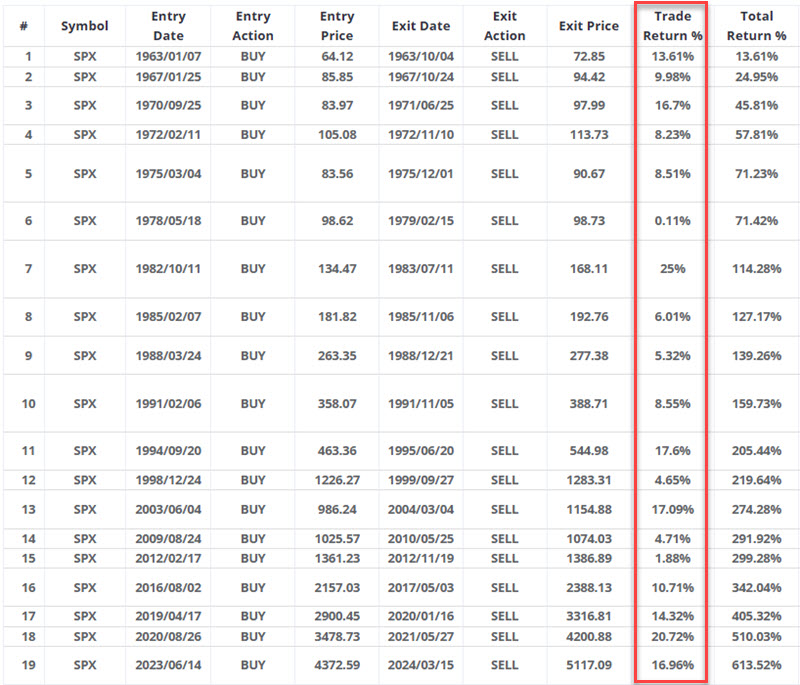
Since 1960, this strategy has generated nineteen consecutive winning trades, i.e., the S&P 500 was higher nine months after a signal in all nineteen instances.
- The average nine-month gain was +11.09%
- The strategy spent only 21.77% of the time in the market
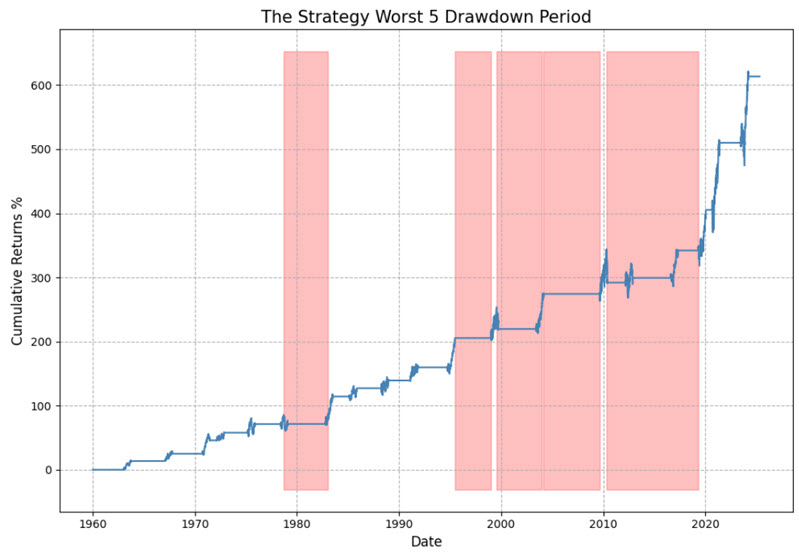
To better understand the nature of the results, the chart below displays the hypothetical cumulative % return from holding a long position in $SPX only during the nine months after a signal.
The table below displays the hypothetical signal-by-signal results.
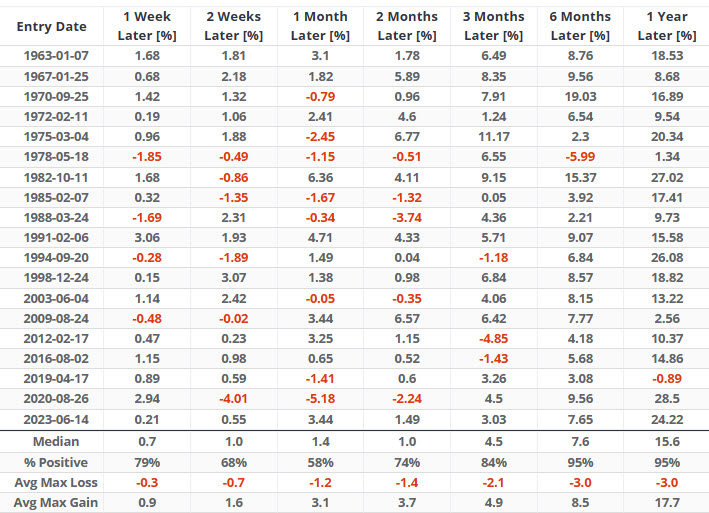
The table below displays SPX performance for different holding periods.
What the research tells us…
It is hard to argue with the results of the strategy detailed above, other than the fact that it is only in the market about 22% of the time, so one could not rely upon it as their sole standalone investment method (not that we would ever recommend such a thing in the first place). And as always, there is no guarantee that the next signal will generate a profit. Still, Sentiment Cycle Panic crossed above 0.78 on 2025-04-08, triggering the first criteria. Now it is a matter of patience and waiting for the indicator to drop back down to -0.78 to trigger a nine-month holding period for the S&P 500 Index. Once that happens-whenever that happens-history suggests the potential for a favorable market environment for the ensuing nine months.