Data &
Technology
Research
Reports
Report Solutions
Reports Library
Actionable
Strategies
Free
Resources
Simple Backtest Calculator
Simple Seasonality Calculator
The Kelly Criterion Calculator
Sentiment Geo Map
Public Research Reports
Free Webinar
Pricing
Company
About
Meet Our Team
In the News
Testimonials
Client Success Stories
Contact
Log inLoginSign up
< BACK TO ALL REPORTS

The Panic Button Has Been Pressed

Jason Goepfert
2020-03-17
Its been several years, but the Panic Button has been pressed. The S&P 500's MACD indicator is hitting historic levels.

The Panic Button has been pressed

It’s been several years, but the Panic Button has been pressed.

The last time we looked at such stress was in January 2016 but we’re far beyond that now. The indicator incorporates measures which spike higher when uncertainty about the economy, corporate outlooks and stock prices are high, and reach extreme high levels only during times of outright panic.

Anything above 3 on the model could be considered “panic.” As a reflection of just how much anxiety is being priced in, on Thursday the Panic Button hit a record high of 7.7. Based on preliminary data, it eclipsed that again on Monday.

Panic Button

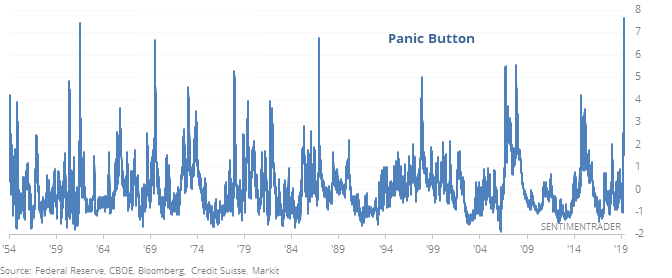
This was a tip-off of something sinister in 2007. Although stocks showed gains over the next 2-3 months, it preceded a large longer-term drawdown. And high panic did not mean an imminent low in most cases, though it was close.
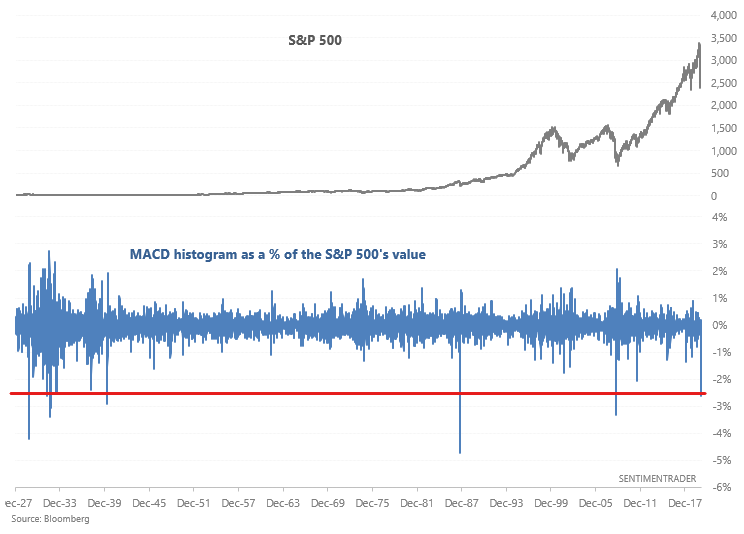

Most extreme ever

The Wall Street Journal noted that the S&P 500's MACD histogram is at its most extreme ever. Check out our Ultimate Guide to MACD for more background on this technical indicator.

The MACD histogram on a multi-decade time frame isn't very useful since it is a nominal figure. We need to calculate the MACD histogram as a % of the S&P 500's value for an apples-to-apples comparison.

S&P MACD

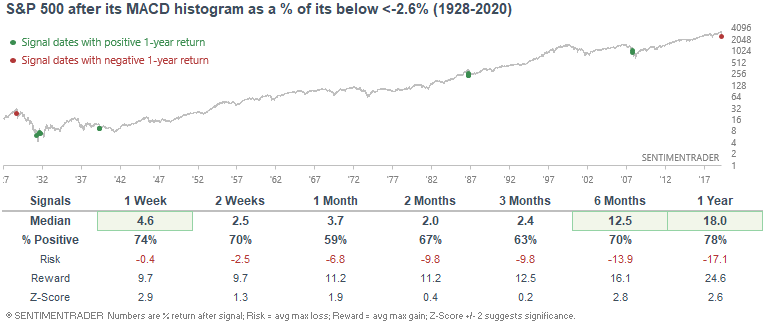
As you may expect, this is still quite extreme. The last 2 times this happened was during the 2008 crash and 1987 crash. Overall, such panicked selling usually led to a bounce over the next week. 

MACD is oversold

This is an abridged version of our recent reports and notes. For immediate access with no obligation, sign up for a 30-day free trial now.

We also looked at:

  • There were no 52-week highs on the NYSE on Monday
  • The CME keeps hiking margin requirements on S&P 500 futures
  • Our Optimism Indexes on SPY and EEM are truly extreme
  • The S&P 500's weekly RSI is hitting rare levels
  • Same for silver...but beware "oversold"
DATA &
TECHnologies
IndicatorEdge
‍
BackTestEdge
‍
Other Tools
‍
DataEdge API
RESEARCH
reports
Research Solution
‍
Reports Library
‍
actionable
Strategies
Trading Strategies
‍
Smart Stock Scanner
‍
FREE
RESOUrCES
Simple Backtest
Calculator
Simple Seasonality
Calculator
The Kelly Criterion
Calculator
Sentiment Geo Map
‍
Public Research Reports
‍
Free Webinar
COMPANY
‍
About
‍
Meet our Team
‍
In the News
‍
Testimonials
‍
Client Success Stories
Pricing
Bundle pricing
‍
Announcements
‍
FAQ
© 2024 Sundial Capital Research Inc. All rights reserved.
Setsail Marketing
TermsPrivacyAffiliate Program
Risk Disclosure: Futures and forex trading contains substantial risk and is not for every investor. An investor could potentially lose all or more than the initial investment. Risk capital is money that can be lost without jeopardizing ones’ financial security or life style. Only risk capital should be used for trading and only those with sufficient risk capital should consider trading. Past performance is not necessarily indicative of future results.

Hypothetical Performance Disclosure: Hypothetical performance results have many inherent limitations, some of which are described below. No representation is being made that any account will or is likely to achieve profits or losses similar to those shown; in fact, there are frequently sharp differences between hypothetical performance results and the actual results subsequently achieved by any particular trading program. One of the limitations of hypothetical performance results is that they are generally prepared with the benefit of hindsight. In addition, hypothetical trading does not involve financial risk, and no hypothetical trading record can completely account for the impact of financial risk of actual trading. for example, the ability to withstand losses or to adhere to a particular trading program in spite of trading losses are material points which can also adversely affect actual trading results. There are numerous other factors related to the markets in general or to the implementation of any specific trading program which cannot be fully accounted for in the preparation of hypothetical performance results and all which can adversely affect trading results.

Testimonial Disclosure: Testimonials appearing on this website may not be representative of other clients or customers and is not a guarantee of future performance or success.