
The overbought condition in technology suggests more upside

Key points:
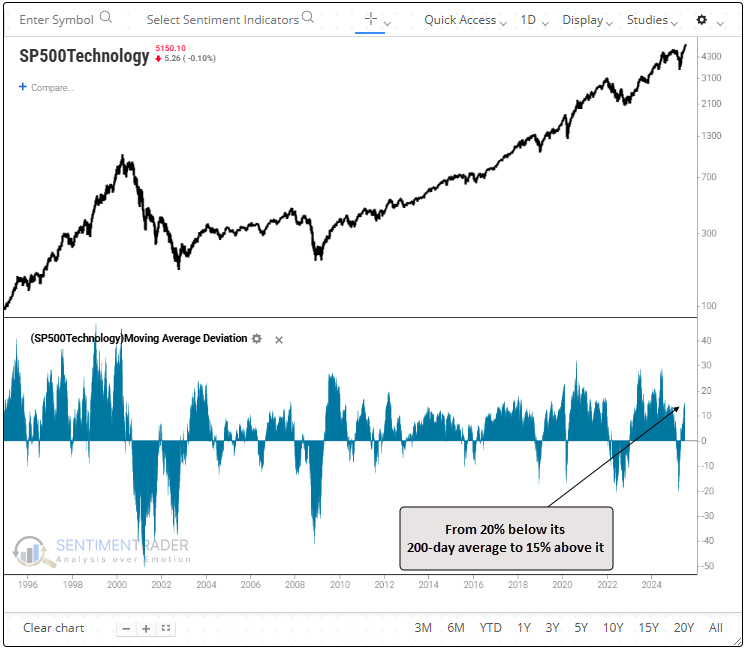
- The S&P 500 Technology sector cycled from 20% below its 200-day average to 15% above it
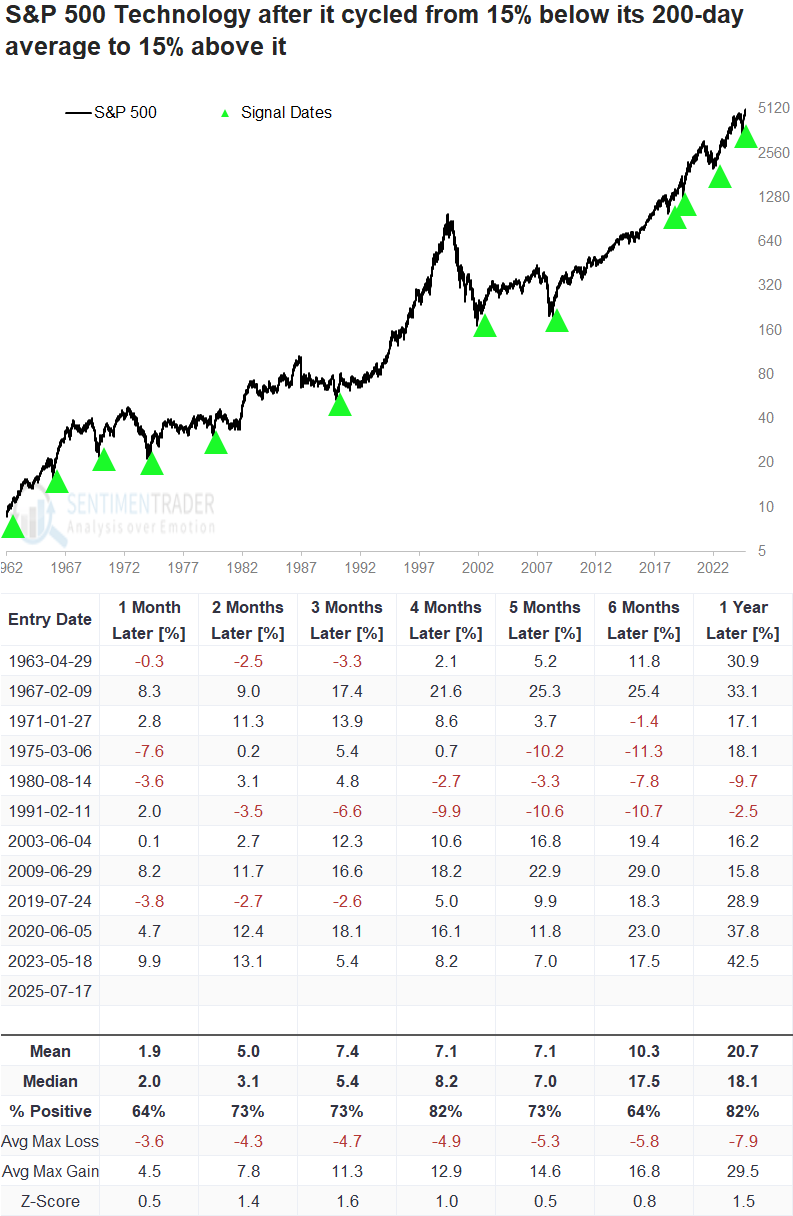
- Following similar shifts, technology posted a gain a year later in all but two instances
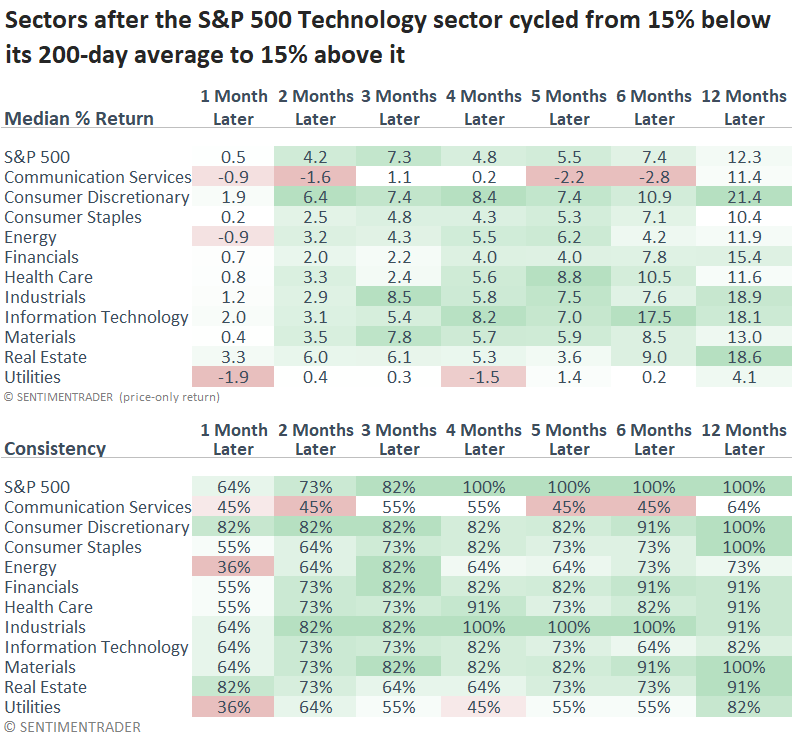
- It also outperformed the S&P 500 across most time frames
Good overbought
When you push a ball deep underwater, it doesn't just float back - it surges. Tech investors know the feeling.
During the depths of the April low, the S&P 500 technology sector fell 20.6% below its 200-day average, a scenario seen in fewer than 4% of trading sessions since 1956. Since then, it rebounded to close 15% above the often-cited long-term average, raising concerns that the sector may be overbought and due for a pullback.
As we've often emphasized, not all overbought conditions are created equal-context matters. In the case of technology, the shift to 15% above the 200-day average comes after an oversold condition, making this a notably different setup.
Solid returns for the technology sector
After the S&P 500 technology sector cycled from at least 15% below its 200-day average to 15% above it, those stocks displayed solid consistency and returns over the following year.
The most recent precedent occurred with the sector at an all-time high, similar to 1967 and 2019. Although there was a modest pullback during the first three months following the 2019 instance, both signals ultimately delivered exceptional one-year returns.
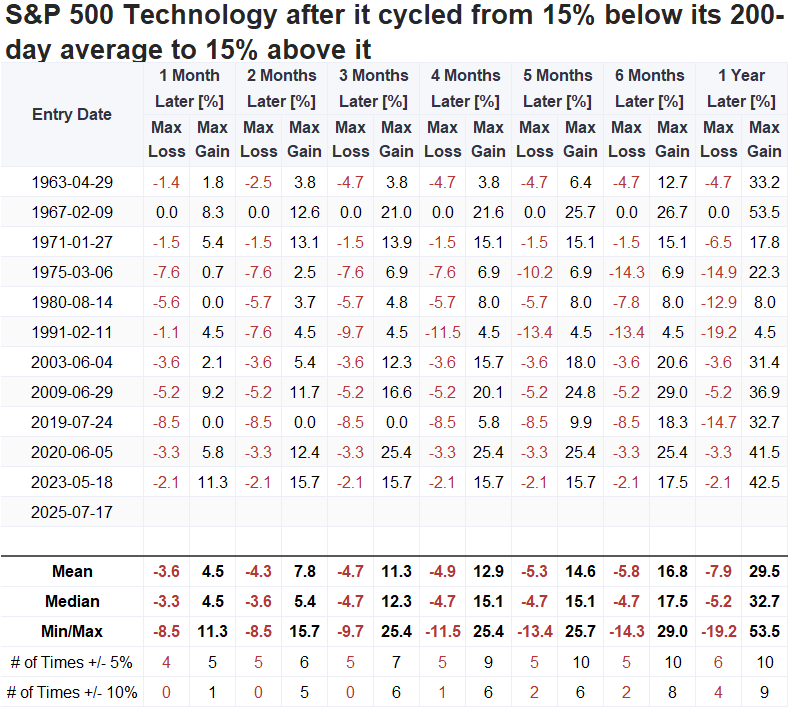
Over the following six months, the S&P 500 technology sector fell by more than 10% on two occasions, but posted gains of more than 10% eight times. That asymmetry suggests a favorable risk/reward profile.
Technology outperformed the S&P 500 in five out of seven horizons, lagging in the two and three-month windows. The "good overbought" condition in technology signaled a favorable overall backdrop, as other offensive-oriented groups outperformed the broad market a year later.
When does an overbought condition become a concern
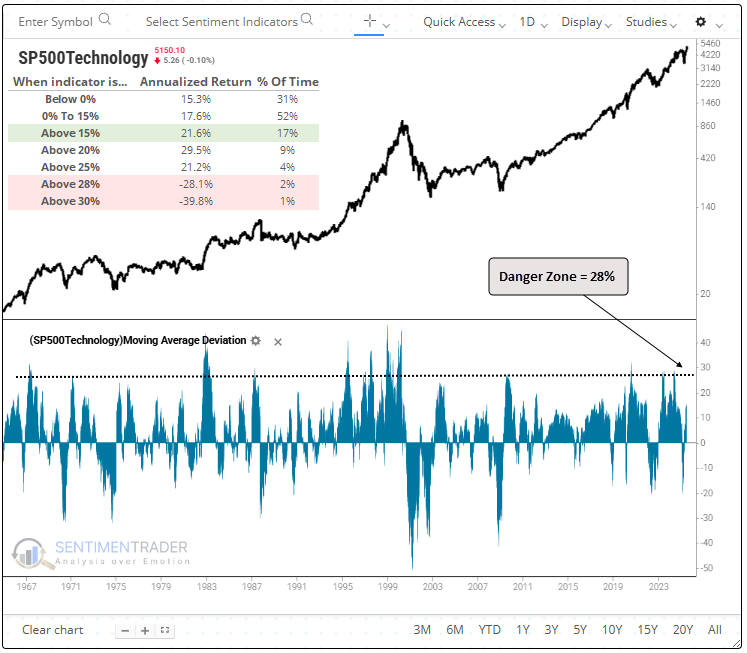
To gauge when the technology sector's deviation above its 200-day average signals an unhealthy overbought condition, I conducted a test to determine the optimal threshold for a short position. The results indicated that a 28% premium is the threshold to watch.
As illustrated in the chart below, annualized returns climb to an impressive 29% when the sector is 20% above the 200-day average but begin to decelerate from that peak at 25% and turn negative beyond 28%.
The popular XLK fund tracks the sector closely, but barely missed the +15% threshold. You can click here to load the moving average deviation test on that fund, then click the Run Backtest button to view the results.
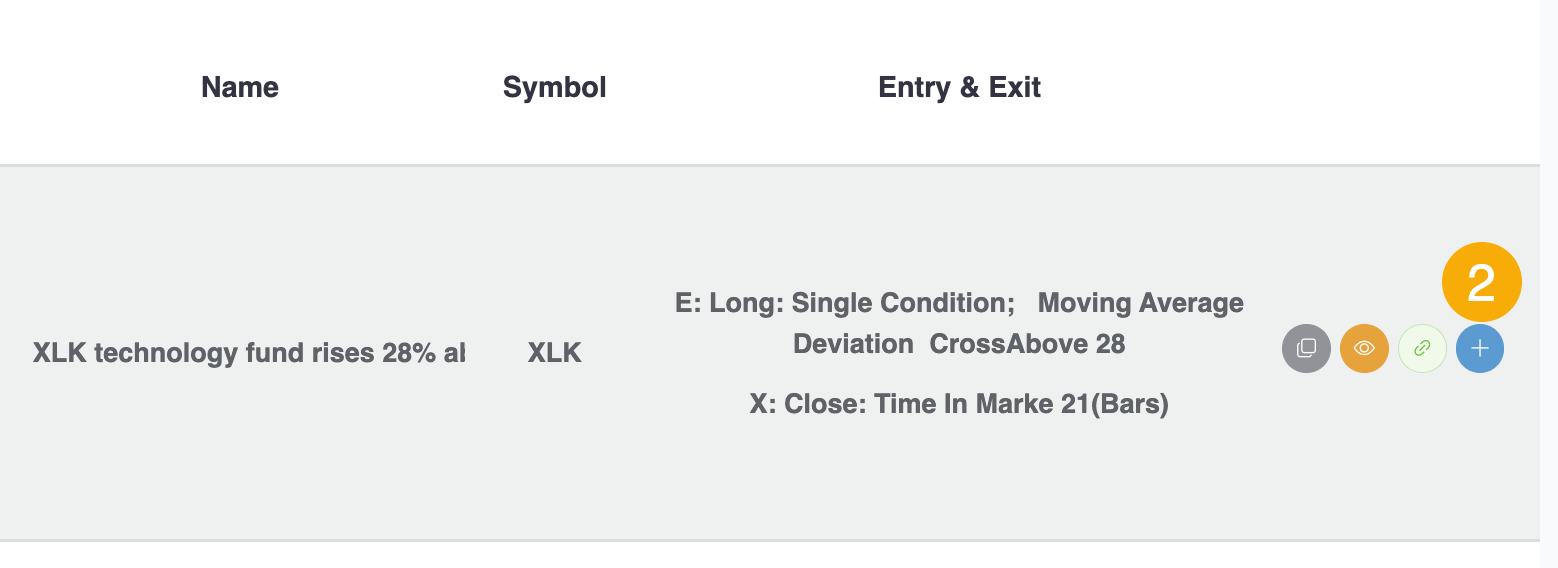
To be alerted when XLK crosses more than 28% above its 200-day average:
- Navigate to the Backtest Engine and click the Analysts' Backtests tab
- Click the plus button on the right-hand side to add the test to your alerts
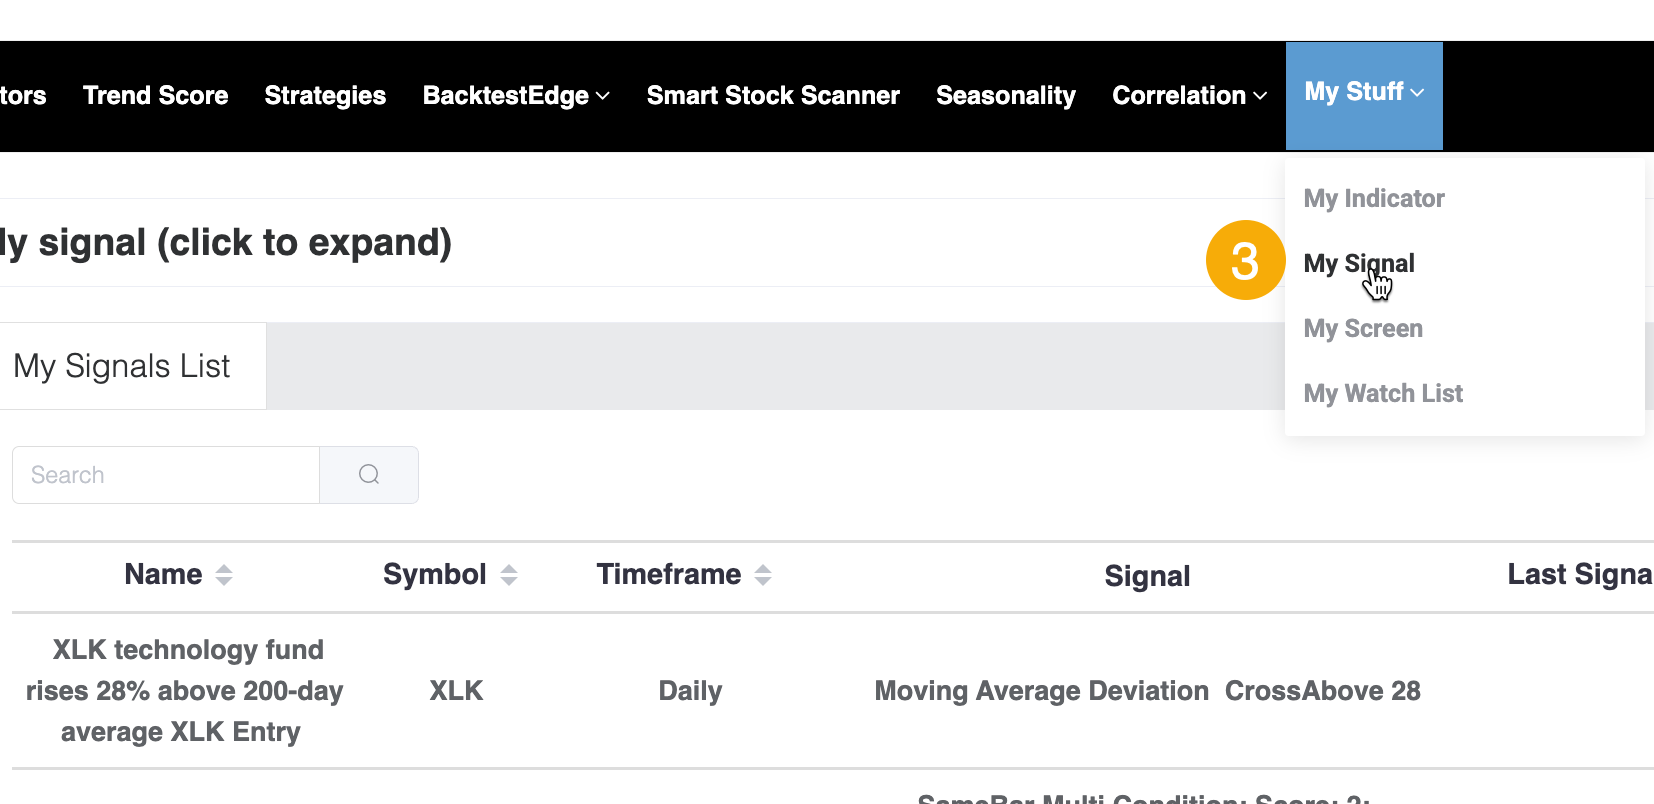
- Go to My Stuff > My Signal and confirm that it has been added to your signals, where you'll be alerted when the conditions are met (you'll also receive an email)

What the research tells us...
The S&P 500 technology sector has recently made a notable shift, climbing from below its 200-day moving average to decisively above it. While some observers might point to its current status as overbought, we view it as a good overbought condition. Historically, such strength often signals not exhaustion but rather a continuation of a robust trend. However, investors may want to consider reducing exposure if the sector rises to 28% above its long-term average.