
The out-of-the-money calendar spread - GLD Edition

Key Points
- The out-of-the-money calendar spread involves buying a longer-dated out-of-the-money call (or put) and simultaneously selling a call (or put) in a closer expiration month
- Trading out-of-the-money options creates the potential for greater reward and reduces the cost of entry
- One key piece to the puzzle is assessing the actual probability of the trade showing a profit sometime during its life
- The other key piece of the puzzle is formulating a trading plan regarding when (or if) to cut a loss and when to take profits should they accrue
Overview
The obvious goal of any speculative position is to make money. The goal of implementation is to "risk a little to make a lot." In other words, how much are you risking, and how much can you reasonably expect to make? Generally speaking, the higher the reward-to-risk ratio, the better. However, that is only one part of the equation.
The other part of the equation is "probability," i.e., what is the likelihood that you will actually realize the hoped-for profit? For instance, you can buy a call option 30% out-of-the-money for next to nothing and give yourself an incredibly massive reward-to-risk ratio. Unfortunately, your probability of making money will likely be exceptionally low.
The other bad news is that there are no "correct" reward-to-risk nor probability of profit values. Each trader must assess each potential opportunity individually and make their own decisions.
NOTE: The example below uses options on ticker GLD (SPDR Gold Shares). This is NOT a recommendation or endorsement that GLD is about to rally. It was chosen solely for its favorable reward-to-risk ratio.
The example trade below has a very favorable reward-to-risk ratio. Regarding the probability of profit, it is a little trickier. The trade will:
- Only show a profit if ticker GLD rallies by some amount between now and the end of September
- The probability of earning the maximum profit potential is low
- However, the likelihood of making a reasonable profit IF GLD does rise in price is reasonably high
The example
The example trade below would only be entertained:
- By a speculative trader confident that gold will rise before September 30th
- OR a speculative trader who doesn't mind risking a small amount of money on the chance of a big move
The trade involves:
- Buying the GLD Nov18 2022 185 call @ $1.23
- Selling the GLD Sep30 2022 185 call @ $0.47
The particulars and risk curves for this trade appear in the figures below (courtesy of Optionsanalysis).
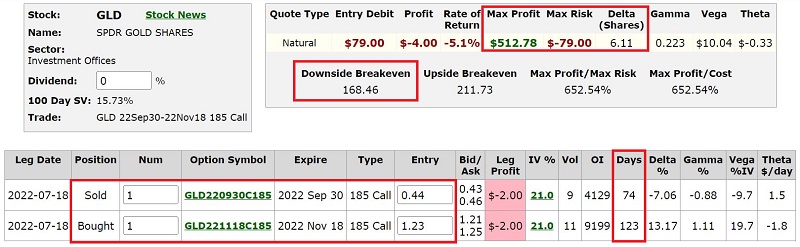
Things to note:
- The cost to enter a 1-lot of this trade is $79, and this also represents the maximum risk
- The breakeven price at the Sep30 option expiration is $168.46
- The trade has a delta of 6.11, which means it will act similarly to a position holding six shares of GLD
A trader can size this trade according to their willingness to accept risk. For example, a trader with a $50K trading account can buy six calls for $474 and risk less than 1% of their trading capital (or they can buy more and risk more, but the point is the trader can actively limit their risk to a specific amount).
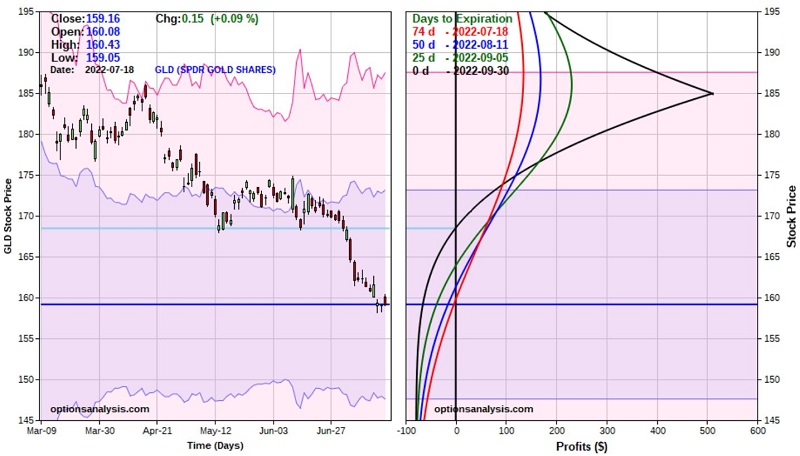
Let's take a closer look at the risk curves above.
- The red line represents the expected profit or loss based on the price of GLD on the date of trade entry
- The black line represents the expected profit or loss as of the Sep30 option expiration
- The blue and green lines represent the expected profit or loss as of 50 days and 25 days left until expiration, respectively
- If GLD declines in price, this trade will lose money, period. Still, the worst-case scenario is a loss of -$79 per 1-lot regardless of how far GLD falls
- If GLD starts to rally, the profit level depends on a) how far it rallies and b) how soon it happens.
Should GLD approach $185 a share, time decay begins to work in favor of this trade (this is because the Sep30 option that was sold will give up its time premium more quickly than the Nov18 option purchased).
Position Management
One thing to remember about options trading is that there are no hard and fast position management rules. So, the ideas below are merely examples of "one way to play."
Risk management:
For example, let's assume a trader with a $50K account buys a 6-lot of the trade above. If GLD starts to decline in price, the trader can either:
- Close out the position early and try to salvage some premium, rather than risking the full $474 paid for a 6-lot, OR
- "Let it ride," knowing they can lose no more than $474. Remember, the November calls don't expire until mid-November, so that leaves four months for "something" favorable to happen
Profit-taking:
This is where things get a little more "free form." In a perfect world, GLD closes at exactly $185 on September 30th and the maximum profit potential of $512 per 1-lot (PSSSST: That's never going to happen). So, the trader needs to formulate a plan for profit taking.
At the very least, the trade should be closed or adjusted if GLD does happen to rally to $185 a share because once GLD moves above $185 a share, the risk curves "roll over" and begin to decline. No reason to stick around for that.
One approach would be to set some specific profit-taking trigger (if GLD hits a certain price, if an open profit of 100% or more occurs, or if a favored overbought indicator reaches overbought territory) and to sell some or all positions at that point.
For example, if an open profit of $474 (on a 6-lot) occurs, the trader might sell a 3-lot and let the rest ride as a risk-free trade. Another possibility is to take profits if the 4-day RSI exceeds 70% (the # of RSI days and the trigger % are merely examples).
In other words, if you are trading more than a 1-lot with options, it makes sense to nail down some profits at the first reasonable opportunity.
What the research tells us…
There isn't really any "research" associated with this example. I am not "touting" gold and am actually very agnostic about the short-term prospects for gold - and by extension - ticker GLD.
But the real point of this piece is to highlight the out-of-the-money calendar spread as a (potentially) low-cost speculative strategy for traders who want the potential for high returns and limited risk - but who also recognize the need to assess probabilities before entering a trade AND the need for a trading plan once a trade is entered. Without these two pieces of the puzzle in place, the odds of success decline dramatically.