Products
SentimenTrader Trading Tools
‍
Backtest Engine
My Trading Toolkit
Correlation Analysis
Seasonality
Market Prediction
Indicators & Data API
‍
Proprietary Indicators & Charts
Market Data API
Strategies & Scanner
‍
50+ Trading Strategies
Smart Stock Scanner
Smart Option Scanner
Research Reports
‍
Research Solutions
Reports Library
Free Resources
Simple Backtest Calculator
Simple Seasonality Calculator
The Kelly Criterion Calculator
Sentiment Geo Map
Public Research Reports
Education
Sentiment Indicators
Technical Indicators
Pricing
Company
About
In the News
Testimonials
Client Success Stories
Contact
Log inLoginSign up
< BACK TO ALL REPORTS

The Optimism Index triggers a buy signal for internet and e-commerce stocks

Dean Christians
2022-11-10
A trading model that uses the Optimism Index triggered a new buy signal for an Emerging Markets Internet and E-Commerce ETF. The alert identifies a shift from pessimism to optimism. After a 73% drawdown over the last 21 months, pessimism is about as bad as it gets for this unloved group of internet stocks.

Key points:

  • A trading model that uses the Optimism Index triggered a buy signal for unloved internet stocks
  • After other alerts, the Emerging Markets Internet and E-commerce ETF rallied 100% of the time 

A mean-reversion opportunity after a massive drawdown

Internet and e-commerce stocks have been some of the hardest hit issues in the current global bear market. As I discussed in a previous note, buy-the-dip trading strategies will struggle in a long, drawn-out bear market. However, sometimes it pays to go against the prevailing trend. 

Remember, an oversold market is a precondition. We need a trigger to take action. So, I created a trading model for the proprietary SentimenTrader Optix Index to take advantage of bearish to bullish sentiment reversals. 


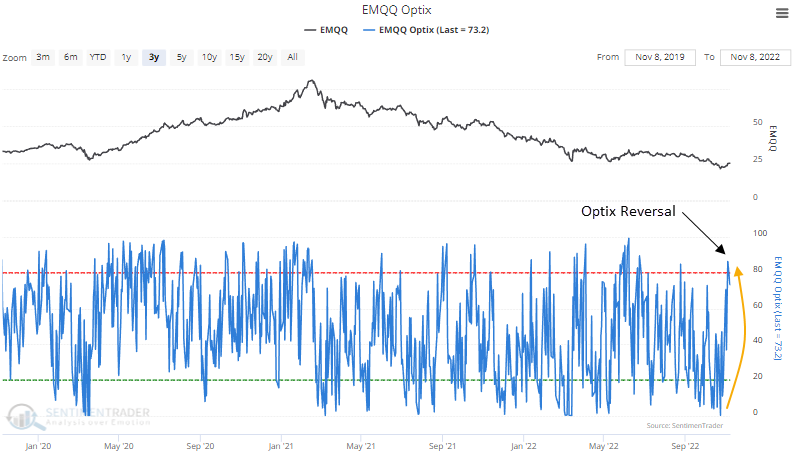
A trading model that identifies a reversal in the Optimism Index

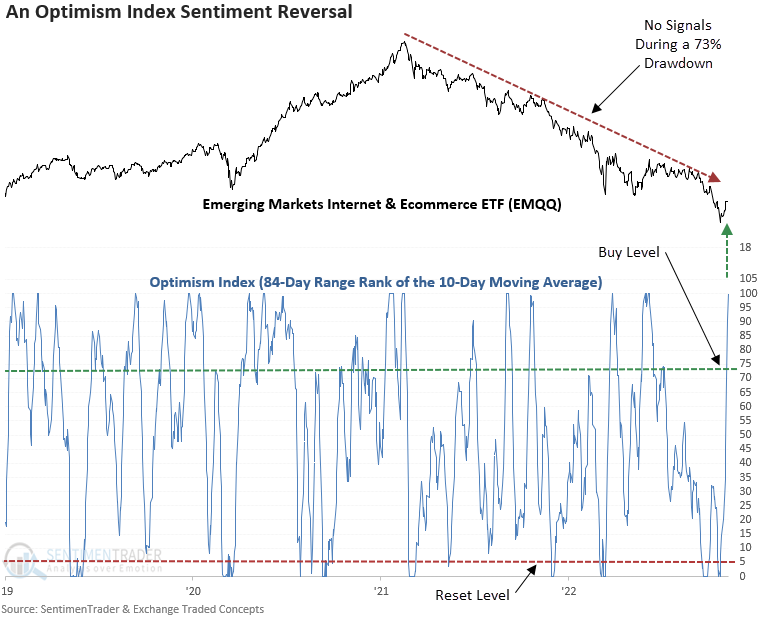
The model applies an 84-day range rank to the 10-day moving average of the Optimism Index for the EMQQ ETF. The range rank indicator measures the current value relative to all other values over a lookback period. 100 is the highest, and 0 is the lowest. The pessimistic reset condition occurs when the range rank for the Optix Index crosses below the 5th percentile. A new buy signal triggers when the range rank exceeds the 73rd percentile and ETF momentum turns positive. 

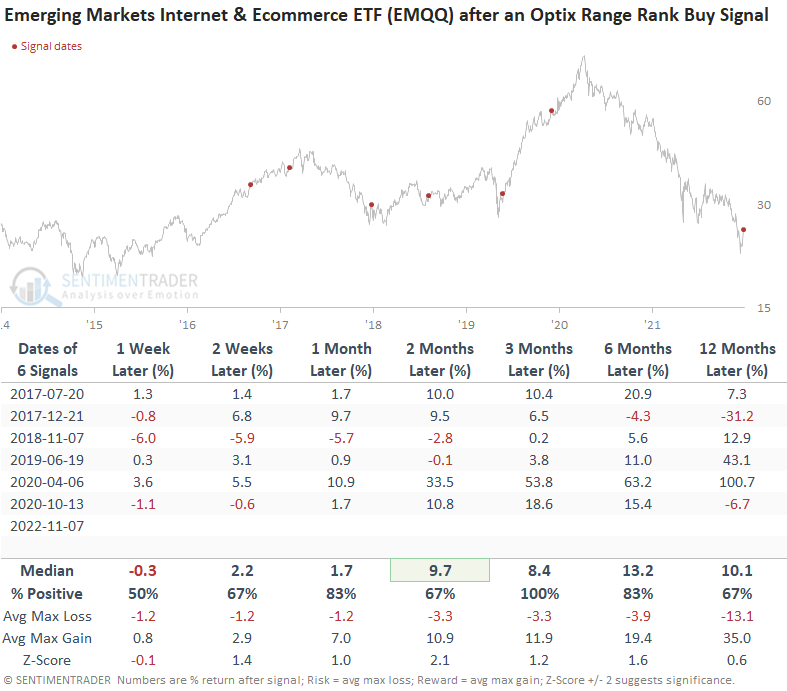
The EMQQ ETF rallied 100% of the time after other signals

The EMQQ ETF is a relatively new security. So, the sample size is small. While the model has enjoyed the benefit of mostly bull market environments, it did an excellent job of avoiding whipsaw alerts during bear markets.

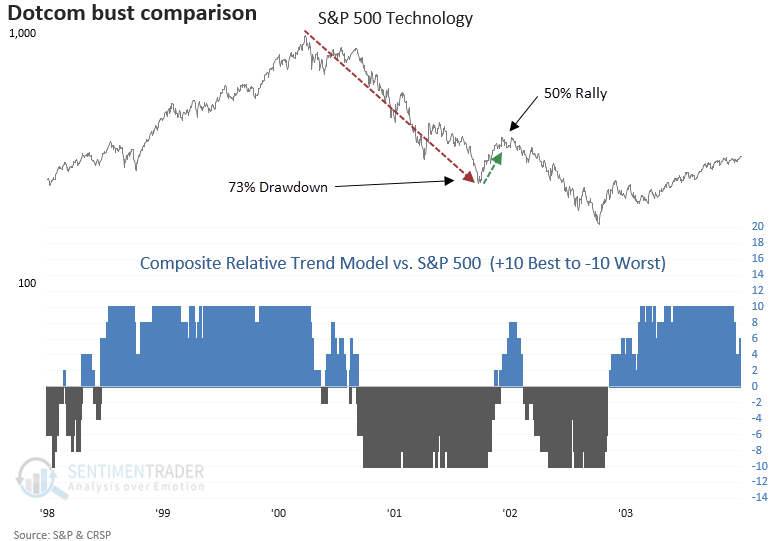
A bear market analog 

The 73% drawdown for the Emerging Markets Internet and E-commerce ETF looks similar to the S&P 500 Technology sector during the Dotcom bust when it fell 74% from March 2000 to September 2001. The ensuing bear market rally pushed Technology stocks up 50% before peaking in early 2002. Of course, monetary policy is vastly different now, with central banks raising rates.

What the research tells us...

With the Emerging Markets Internet and E-commerce ETF (EMQQ) down 73% on a peak-to-trough basis, the stocks in the index have most likely discounted a lot of bad news. Buying oversold conditions in a bear market is not for the faint of heart and requires great discipline and patience. I use the Optimism Index to identify swing trades in bull and bear markets. Regardless of the market environment, one should always adhere to strict money management guidelines when investing or trading.

PRODUCTS
SentimenTrader
Trading Tools
Indicators & Data API
‍
Strategies & Scanner
‍
Research Reports
FREE
RESOUrCES
Simple Backtest
Calculator
Simple Seasonality
Calculator
The Kelly Criterion
Calculator
Sentiment Geo Map
‍
Public Research Reports
‍
Education
Sentiment Indicators
‍
Technical Indicators
‍
Pricing
Bundle pricing
‍
FAQ
‍
Announcements
‍
COMPANY
‍
About
‍
In the News
‍
Testimonials
‍
Client Success Stories
CONTACT
‍
General Inquiries
‍
Media Inquiries
‍
Financial Professionals Inquiries
‍
© 2026 Sundial Capital Research Inc. All rights reserved.
Setsail Marketing
TermsPrivacyAffiliate Program
Risk Disclosure: The information and tools provided are for research and analytical purposes only and are not intended as investment advice. Market analysis involves uncertainty, and outcomes may differ from expectations. Users should conduct their own due diligence and consider their individual circumstances before making any financial decisions. Past performance is not necessarily indicative of future results.

Hypothetical Performance Disclosure: Hypothetical performance results have many inherent limitations, some of which are described below. No representation is being made that any account will or is likely to achieve profits or losses similar to those shown; in fact, there are frequently sharp differences between hypothetical performance results and the actual results subsequently achieved by any particular trading program. One of the limitations of hypothetical performance results is that they are generally prepared with the benefit of hindsight. In addition, hypothetical trading does not involve financial risk, and no hypothetical trading record can completely account for the impact of financial risk of actual trading. for example, the ability to withstand losses or to adhere to a particular trading program in spite of trading losses are material points which can also adversely affect actual trading results. There are numerous other factors related to the markets in general or to the implementation of any specific trading program which cannot be fully accounted for in the preparation of hypothetical performance results and all which can adversely affect trading results.

Testimonial Disclosure: Testimonials appearing on this website may not be representative of other clients or customers and is not a guarantee of future performance or success.