
The November/December Power Period

Key points
- A 9-day period encompassing late November into early December has shown a long-term tendency to be favorable for stocks
- This period has shown a gain 76% of the time over the last 72 years
- A long position in S&P 500 futures or an S&P 500 ETF (SPY or VOO) is the purest play
The November/December Power Period
The period we will examine is the 9-trading day period that extends:
- From the close of the 7th to the last trading day of November
- Through the close on the 3rd trading day of December
In plain English, we are talking about being long the S&P 500 Index during the last six trading days of November plus the first three trading days of December.
For 2023, this period will extend from:
- The close on 2023-11-21
- Through the close on 2023-12-05
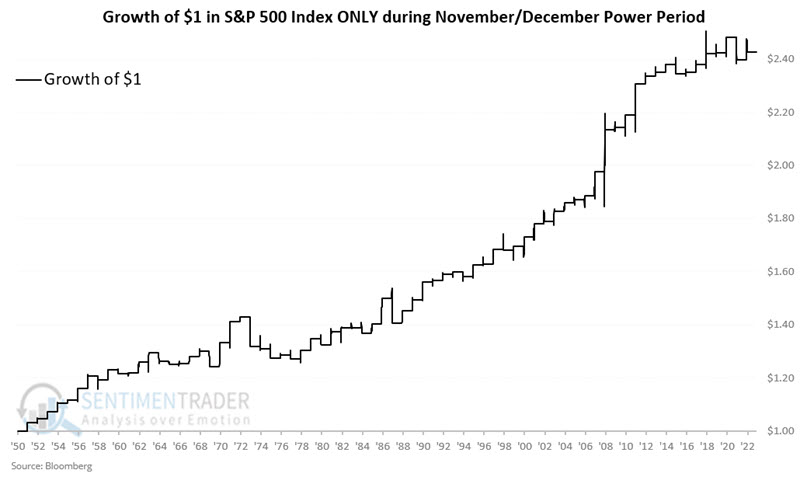
A review of 72 years of history
The chart below displays the cumulative growth of $1 invested in the S&P 500 Index (price-performance only) every year during the five days described above, starting in 1951.
The table below displays the results of this test.
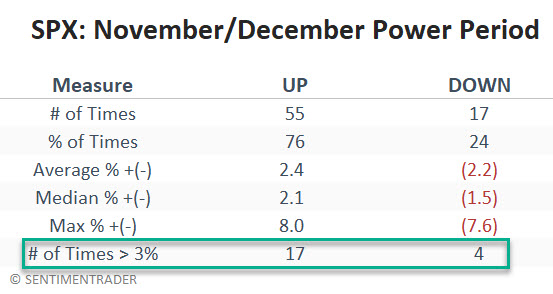
The good news is that the S&P 500 has shown a gain during this period in roughly 3 out of every four years over the past 72 years, and the average and median gain was larger than the average and median loss. The most significant piece of good news - as highlighted in the table above - is that large gains (defined as 3% or more over the nine days) outnumbered large losses by a whopping 17 to 4 ratio. If we expand the count to include gains or losses of plus or minus 2% or more, the ratio is 29 up years to 6 down years.
The bad news is that this "trend" is in no way a "sure thing" on a year-to-year basis. The largest 9-day losses occurred in 1973 (-7.6%), 1987 (-6.2%), 1969 (-4.4%) and 2021 (-3.4%). So the sobering reality is that it would not be unprecedented if this 9-day period lost -7.6% in 2023.
A word on real-world trading
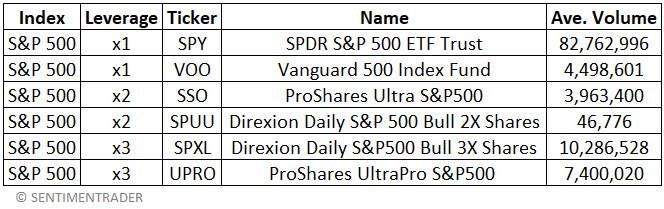
This quirky seasonal tendency is clearly for short-term traders only. This is not a position on which to "bet the ranch" but merely a potential opportunity for aggressive traders to try to exploit. The most straightforward approach would be to buy S&P 500 Index futures (ticker ES) for those inclined and/or willing to trade futures contracts. Non-futures traders could consider buying shares of an S&P 500 Index ETF such as tickers SPY or VOO. In any event, the results shown above do not relieve a trader of their responsibility to consider the risk side of the equation and formulate a plan for cutting a loss based on their personal tolerance for risk.
For traders willing to accept an even higher degree of risk, the table below highlights S&P 500 ETFs that offer 2x and 3x leverage. It should be mentioned that 2x and 3x funds can experience large declines very quickly, so once again, reasonable position sizing is a top priority in limiting downside risk.
What the research tells us…
The market has bounced sharply off its October lows, and several bullish market thrust and breadth signals have accompanied the rally. Does this guarantee a continuation? The reality is that only time will tell. Is the S&P 500 Index (and attendant index funds) certain to trade higher during these nine trading days in 2023? Of course not. There are no "sure things" in the financial markets, and 2023 could easily be one of those "off years."
At the same time, a 76% Win Rate combined with a Median Win/Median Loss ratio of almost 1.5-to-1 over 72 years offers a potential "edge" that some traders may find compelling.