
The November-January Trifecta

Key Points
- The S&P 500 is on the verge of registering its third straight up month, with the third month being January
- We refer to an up November, December, and January as a "November-January Trifecta"
- Historically, the market has performed well during the 12 months following a November-January Trifecta
The November-January Trifecta
As detailed here, the stock market tends to perform well in the twelve months following a higher monthly close for the S&P 500 Index in January. Barring a massive selloff in the last few days of January 2024, the index will close higher this month, triggering a favorable signal. But it gets better. November and December of 2023 both saw the S&P 500 Index register a gain. Does this matter? Let's consider some history, and you can decide for yourself.
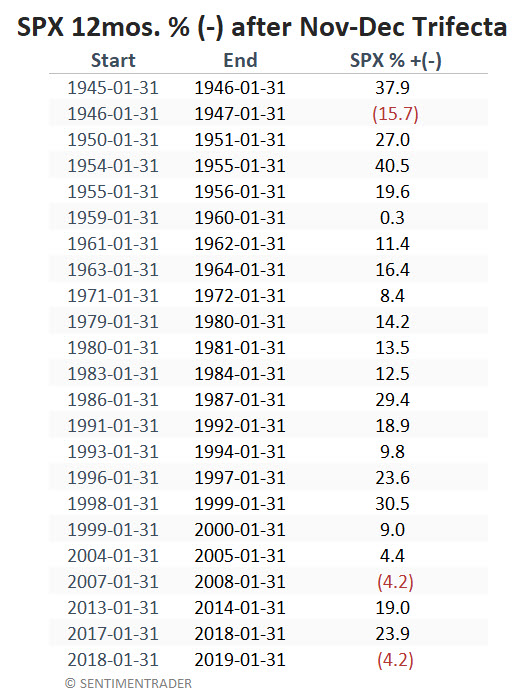
The table below displays the 12-month return for the S&P 500 Index measured from the end of January to the end of the following January after the index showed a gain during November, December, and January.
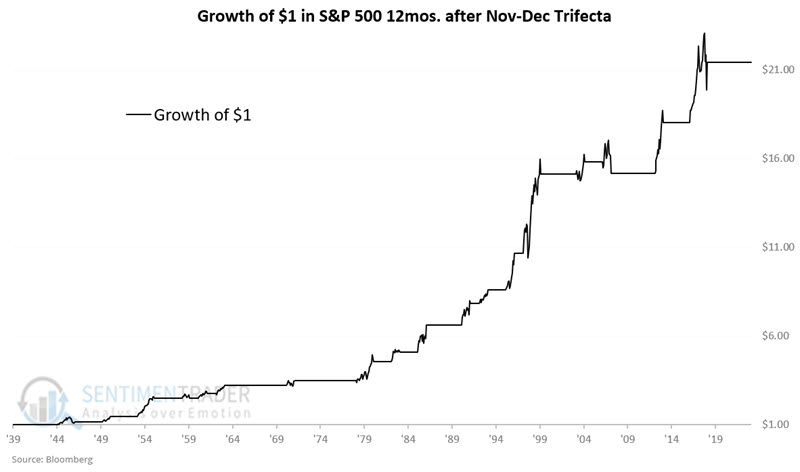
The chart below displays the growth of $1 invested in the S&P 500 only during the 12-month periods highlighted in the table above.
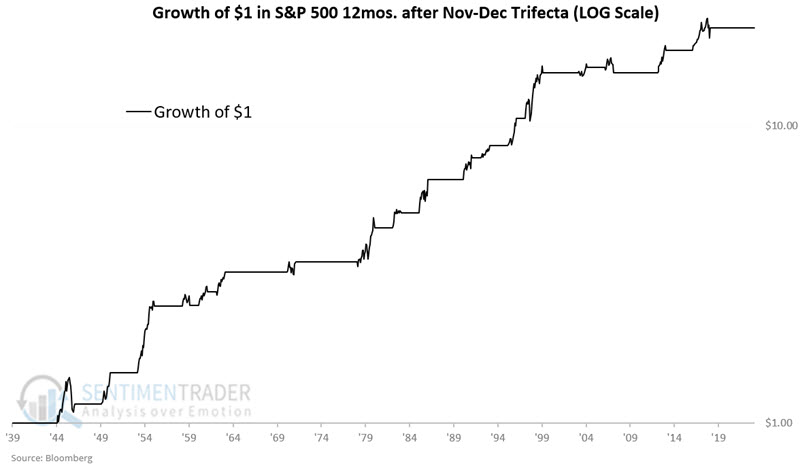
The chart below displays the same result on a logarithmic scale.
The table below summarizes S&P 500 performance following a November-December trifecta.
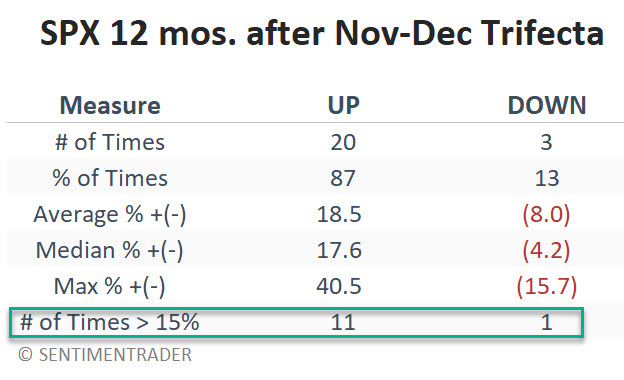
The overall Win Rate of 87% is compelling. One concern is that two of the last four trifectas (2007-2008 and 2018-2019) were followed by 12-month declines of -4.2% for the S&P 500 Index. Likewise, 1946-1947 witnessed a significant decline of -15.7%. This serves as a reminder that there are no "sure things" in the stock market and that this should be viewed not as a "trading system" but rather as a weight of the evidence indicator.
On the plus side, the average and median gains (18.5% and 17.6%, respectively) far outstrip the average and median declines (-8.0% and -4.2%) and 12-month moves of 15% or more skew positive by an 11-to-1 ratio. If the market will make a big move in 2024, history strongly suggests that the move will be to the upside.
What the research tells us…
The problem with any seasonal-based indicator is that explaining "why" it works is hard. So, a leap of faith on the part of the investor is required to believe that what the historical record says will have any meaning in the future. That said, the history presented in this article suggests a strong tendency for the market to perform well in the year ahead if January witnesses positive market results. The information above suggests a higher likelihood of positive results if January joins November and December in the plus column.