Products
SentimenTrader Trading Tools
‍
Backtest Engine
My Trading Toolkit
Correlation Analysis
Seasonality
Market Prediction
Indicators & Data API
‍
Proprietary Indicators & Charts
Market Data API
Strategies & Scanner
‍
50+ Trading Strategies
Smart Stock Scanner
Smart Option Scanner
Research Reports
‍
Research Solutions
Reports Library
Free Resources
Simple Backtest Calculator
Simple Seasonality Calculator
The Kelly Criterion Calculator
Sentiment Geo Map
Public Research Reports
Education
Sentiment Indicators
Technical Indicators
Pricing
Company
About
In the News
Testimonials
Client Success Stories
Contact
Log inLoginSign up
< BACK TO ALL REPORTS

The Nikkei 225 Hits the Brakes

by Sentimentrader
2026-03-05
The Nikkei 225 slumped over 7.5% after a 252-day high with market breadth collapsing sharply. Historical data signals mixed short-term returns but a favorable long-term risk-reward profile post extreme breadth drops.

Key Points:

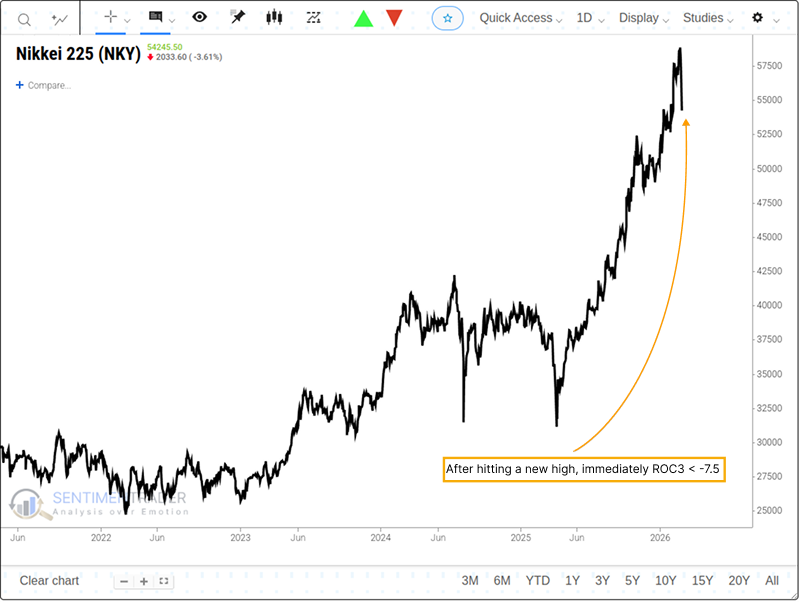
  • The Nikkei 225 Index plummeted by more than -7.5% in the short term after hitting a new all-time high.
  • Its short-term market breadth also experienced a sharp and rapid decline.
  • Historical data offers partial insights, indicating that the outlook is not uniformly optimistic.

Turmoil Deals a Blow to Market Fervor

The recent complex international market environment has directly impacted Japan's stock market. After setting a new high over 252 trading days, the Nikkei 225 Index saw its maximum 3-day drop exceed -7.5% within a single month.
The Nikkei 225 Hits the Brakes

Market Performance in Similar Scenarios

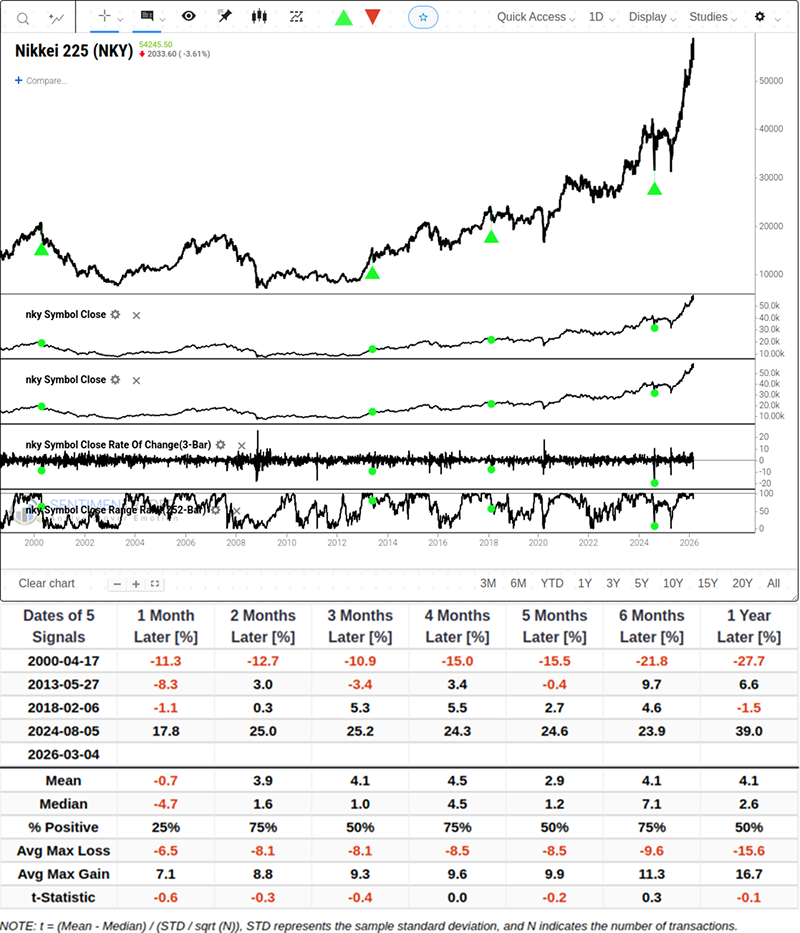
This type of scenario is rare when examining historical data. Since 2000, this signal has been triggered only 5 times, including the current episode.Related Backtest Click Here.
The Nikkei 225 Hits the Brakes

In such extreme cases, the market posted an average return of -0.7% one month later, with only a 25% probability of positive performance. As we have consistently noted, signals of this magnitude hold no statistical significance-they merely illustrate how the market behaved during similar extreme historical episodes.

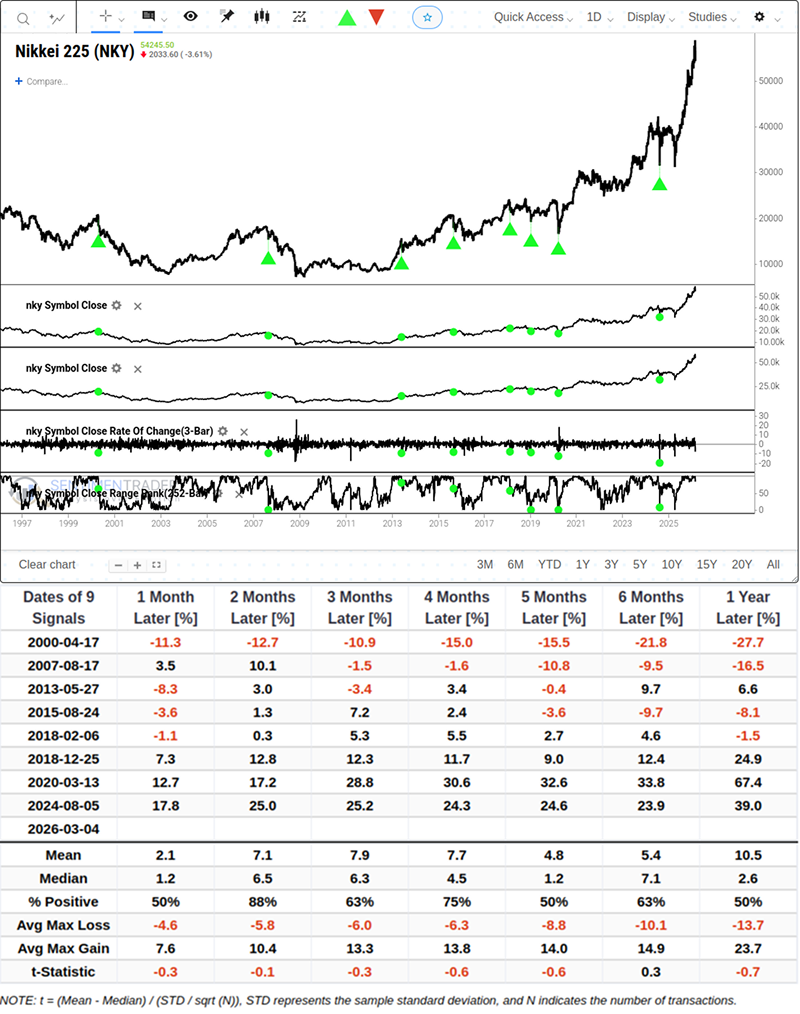
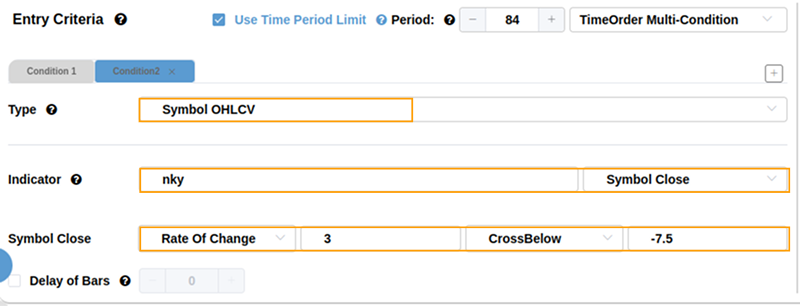
If we slightly expand the observation window to look for instances where "a 3-day drop of over -7.5% occurred within four months of a new high", we identify 9 historical signals. While these still cannot serve as a trading signal, they provide us with some valuable insights.Related Backtest Click Here.
The Nikkei 225 Hits the Brakes

Long-term win rate data reminds us that a "deep V-shaped" crash on price charts alone cannot be used as a basis for safe long-term position building.

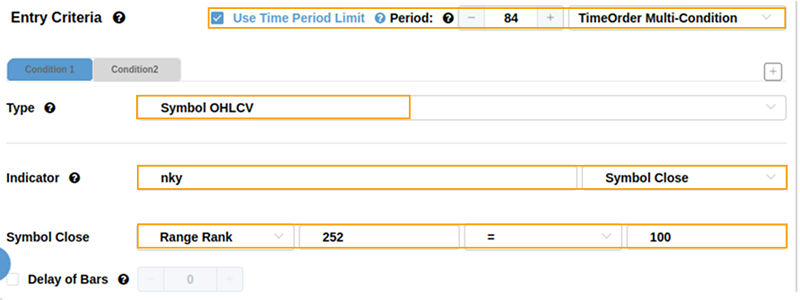
In backtesting, modify the parameters below to set the maximum interval between the occurrence of two conditions. The figure below shows the relevant backtesting settings.
The Nikkei 225 Hits the Brakes

The Nikkei 225 Hits the Brakes

A Cliff-Like Collapse in Short-Term Market Breadth

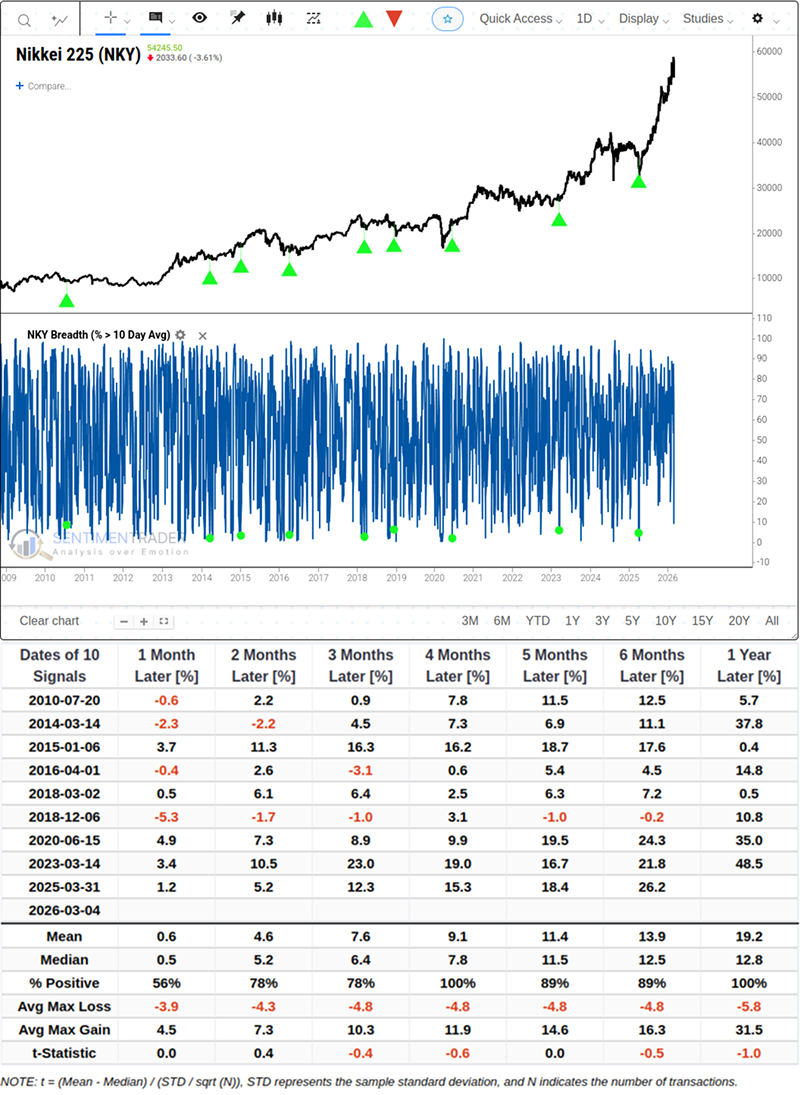
Pure price indicators are prone to noise, so let us examine the market's internal "breadth".

In recent days, this breadth indicator has plummeted from the extremely optimistic zone above 80% to the extremely oversold zone below 10% in just about four trading days.Related Backtest Click Here.
The Nikkei 225 Hits the Brakes

Backtest data yields more interesting results here. In the 9 previous instances of such extreme breadth collapses, the Nikkei Index delivered an average return of 9.1% over the subsequent four months-with positive returns recorded in all 9 cases.

What the Research Tells Us...

Overall, while historical data following breadth collapses shows favorable risk-reward characteristics, it cannot serve as an absolute investment endorsement due to the limitations of sample size.

Every fluctuation in financial markets is a tug-of-war between sentiment indicators and fundamental realities. In the face of the Nikkei's recent sharp adjustment, these quantitative signals are not a call to blind action. When referencing these historical win rates, we must weigh the current energy supply chain shocks and uncertainties surrounding central bank policies in our decision-making.

PRODUCTS
SentimenTrader
Trading Tools
Indicators & Data API
‍
Strategies & Scanner
‍
Research Reports
FREE
RESOUrCES
Simple Backtest
Calculator
Simple Seasonality
Calculator
The Kelly Criterion
Calculator
Sentiment Geo Map
‍
Public Research Reports
‍
Education
Sentiment Indicators
‍
Technical Indicators
‍
Pricing
Bundle pricing
‍
FAQ
‍
Announcements
‍
COMPANY
‍
About
‍
In the News
‍
Testimonials
‍
Client Success Stories
CONTACT
‍
General Inquiries
‍
Media Inquiries
‍
Financial Professionals Inquiries
‍
© 2026 Sundial Capital Research Inc. All rights reserved.
Setsail Marketing
TermsPrivacyAffiliate Program
Risk Disclosure: The information and tools provided are for research and analytical purposes only and are not intended as investment advice. Market analysis involves uncertainty, and outcomes may differ from expectations. Users should conduct their own due diligence and consider their individual circumstances before making any financial decisions. Past performance is not necessarily indicative of future results.

Hypothetical Performance Disclosure: Hypothetical performance results have many inherent limitations, some of which are described below. No representation is being made that any account will or is likely to achieve profits or losses similar to those shown; in fact, there are frequently sharp differences between hypothetical performance results and the actual results subsequently achieved by any particular trading program. One of the limitations of hypothetical performance results is that they are generally prepared with the benefit of hindsight. In addition, hypothetical trading does not involve financial risk, and no hypothetical trading record can completely account for the impact of financial risk of actual trading. for example, the ability to withstand losses or to adhere to a particular trading program in spite of trading losses are material points which can also adversely affect actual trading results. There are numerous other factors related to the markets in general or to the implementation of any specific trading program which cannot be fully accounted for in the preparation of hypothetical performance results and all which can adversely affect trading results.

Testimonial Disclosure: Testimonials appearing on this website may not be representative of other clients or customers and is not a guarantee of future performance or success.