Products
SentimenTrader Trading Tools
‍
Backtest Engine
My Trading Toolkit
Correlation Analysis
Seasonality
Market Prediction
Indicators & Data API
‍
Proprietary Indicators & Charts
Market Data API
Strategies & Scanner
‍
50+ Trading Strategies
Smart Stock Scanner
Smart Option Scanner
Research Reports
‍
Research Solutions
Reports Library
Free Resources
Simple Backtest Calculator
Simple Seasonality Calculator
The Kelly Criterion Calculator
Sentiment Geo Map
Public Research Reports
Education
Sentiment Indicators
Technical Indicators
Pricing
Company
About
In the News
Testimonials
Client Success Stories
Contact
Log inLoginSign up
< BACK TO ALL REPORTS

The never ending global stock market rally

Troy Bombardia
2020-11-17
Stocks continue to rally non-stop around the world, particularly in the Asia-Pacific region.

Stocks continue to rally non-stop around the world, particularly in the Asia-Pacific region. The media claims this is due to the election's results, covid-19 vaccines, and Asia's new free trade bloc. Regardless of the reason, the past 2 weeks have seen strong sector shifts within the U.S. and broad-based rallies outside of the U.S.

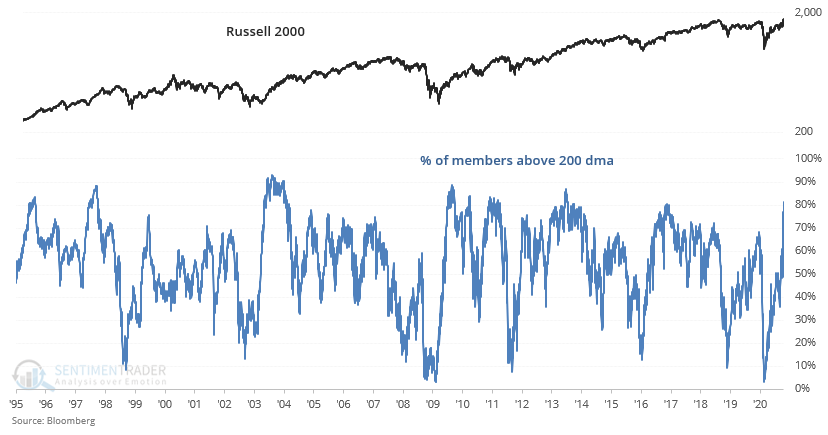
Small cap equities jumped higher, pushing the % of Russell 2000 stocks in a long term uptrend to its highest level in years.

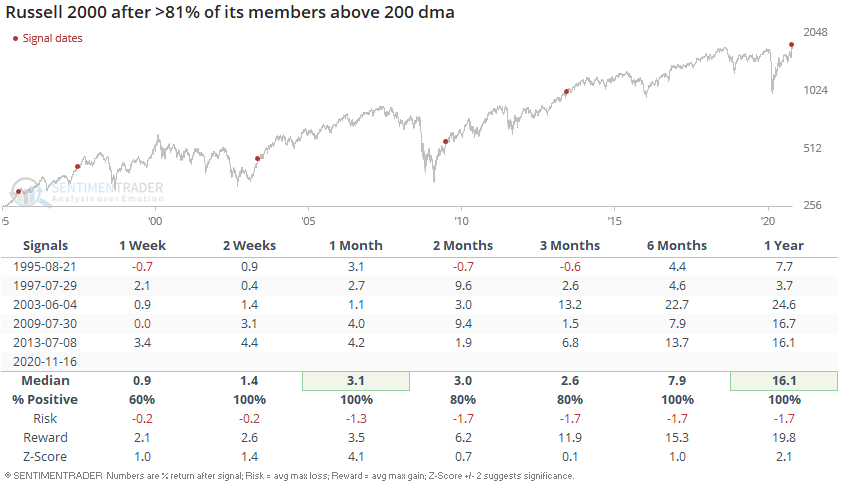
Such strong momentum was typical of how prior bull markets began, which is why all 5 historical cases saw more gains over the next year:

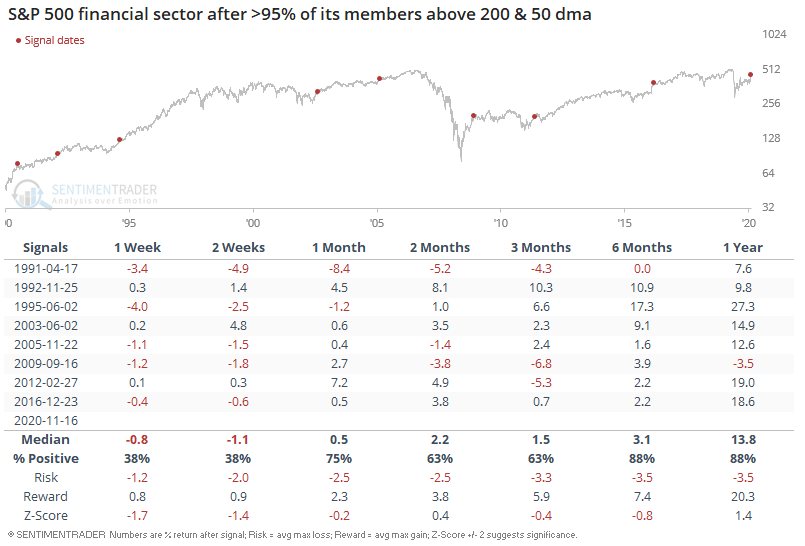
Sector rotation is noticeable among financial, energy, and industrial stocks. More than 95% of financial stocks are above their 50 and 200 dma's:

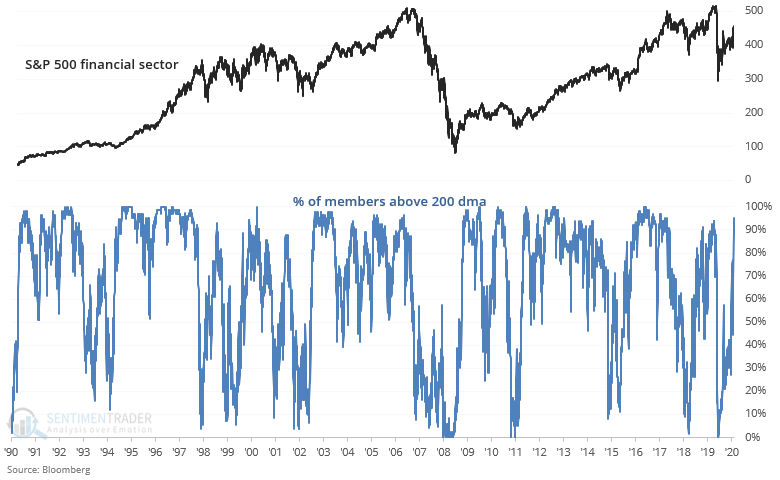
Once again, such strong momentum usually led to more gains for financial stocks over the next year:

In Asia, Japanese Optix's 10 dma is at one of its highest readings ever:

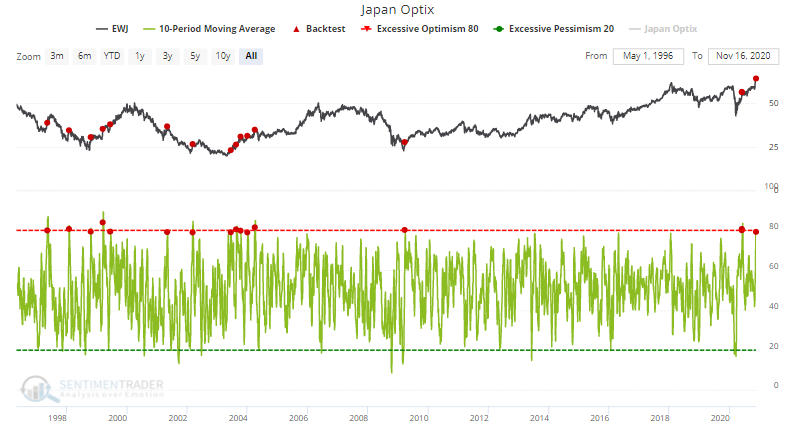
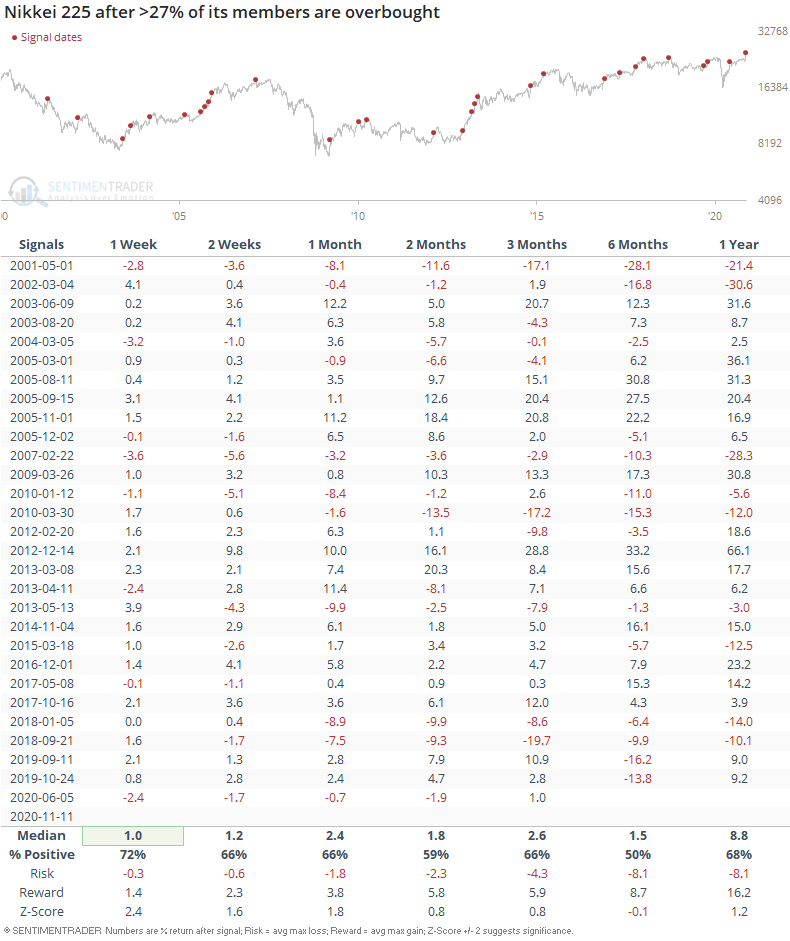
But contrary to what you may expect, this was not a consistently bearish factor for Japanese stocks. Almost 30% of Japanese stocks were recently overbought:

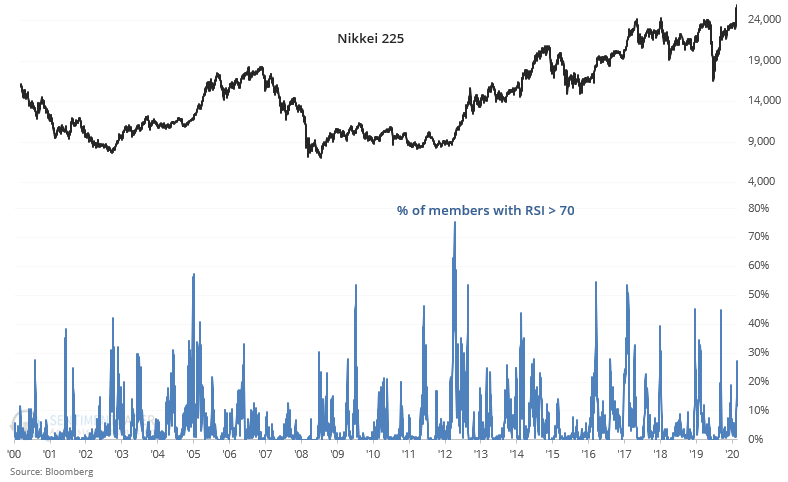
Once again, this was not a consistently bearish factor for Japanese equities on any time frame going forward:

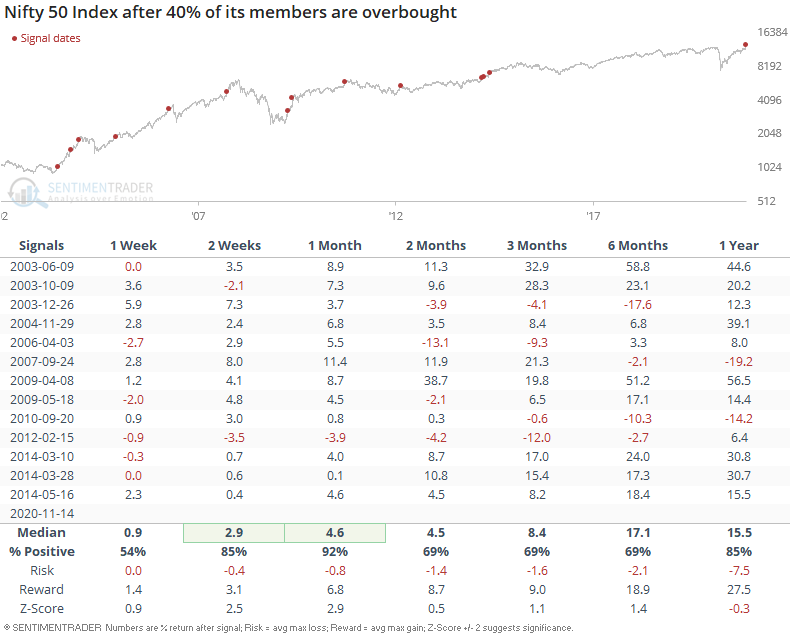
Elsewhere in Asia, 40% of Nifty 50 (India) stocks are overbought:

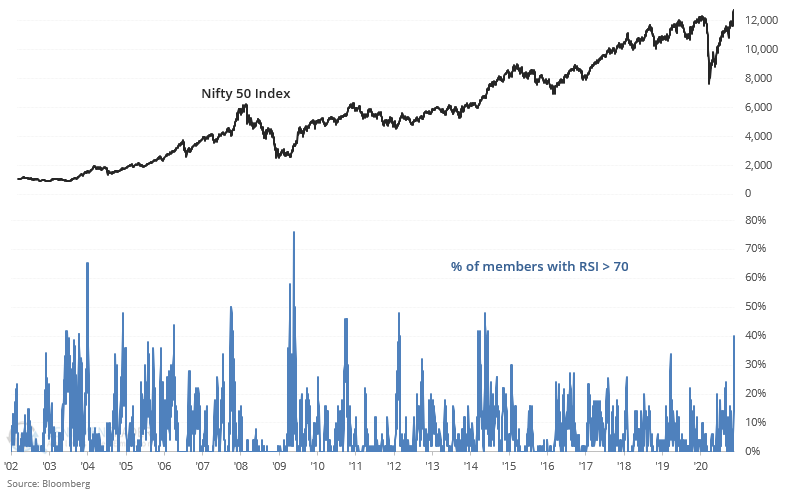
Once again, things are not always as they appear. Contrary to being a bearish sign for Indian equities, this was a short term bullish sign for the Nifty 50 over the next 2-4 weeks:

PRODUCTS
SentimenTrader
Trading Tools
Indicators & Data API
‍
Strategies & Scanner
‍
Research Reports
FREE
RESOUrCES
Simple Backtest
Calculator
Simple Seasonality
Calculator
The Kelly Criterion
Calculator
Sentiment Geo Map
‍
Public Research Reports
‍
Education
Sentiment Indicators
‍
Technical Indicators
‍
Pricing
Bundle pricing
‍
FAQ
‍
Announcements
‍
COMPANY
‍
About
‍
In the News
‍
Testimonials
‍
Client Success Stories
CONTACT
‍
General Inquiries
‍
Media Inquiries
‍
Financial Professionals Inquiries
‍
© 2026 Sundial Capital Research Inc. All rights reserved.
Setsail Marketing
TermsPrivacyAffiliate Program
Risk Disclosure: The information and tools provided are for research and analytical purposes only and are not intended as investment advice. Market analysis involves uncertainty, and outcomes may differ from expectations. Users should conduct their own due diligence and consider their individual circumstances before making any financial decisions. Past performance is not necessarily indicative of future results.

Hypothetical Performance Disclosure: Hypothetical performance results have many inherent limitations, some of which are described below. No representation is being made that any account will or is likely to achieve profits or losses similar to those shown; in fact, there are frequently sharp differences between hypothetical performance results and the actual results subsequently achieved by any particular trading program. One of the limitations of hypothetical performance results is that they are generally prepared with the benefit of hindsight. In addition, hypothetical trading does not involve financial risk, and no hypothetical trading record can completely account for the impact of financial risk of actual trading. for example, the ability to withstand losses or to adhere to a particular trading program in spite of trading losses are material points which can also adversely affect actual trading results. There are numerous other factors related to the markets in general or to the implementation of any specific trading program which cannot be fully accounted for in the preparation of hypothetical performance results and all which can adversely affect trading results.

Testimonial Disclosure: Testimonials appearing on this website may not be representative of other clients or customers and is not a guarantee of future performance or success.