
The natural gas conundrum

Key points:
- Seasonality should rarely be used as a standalone method for trading
- The recent action in natural gas reminds us that a contingency plan is needed in case things don't go as hoped or expected
- Natural gas is now entering its most unfavorable seasonal period, raising the question, "is it too late to sell short?"
A few comments on seasonality
I follow a lot of seasonal trends. I use them to help spot potential opportunities and to confirm or deny trend signals from other indicators. But I rarely use seasonality as the sole basis for entering a trade.
A persistent seasonal trend tells me when to look for an opportunity in a given market. I then look for either price trend confirmation in line with the anticipated seasonal trend or an oversold (if buying) or overbought (if selling short) situation that sets up a potential move in the direction of the anticipated seasonal trend.
I also would never trade based on a seasonal trend without a stop-loss order in place. An exception would be if I trade an option that automatically limits the amount of money that can be lost to the premium paid.
On September 13, I wrote this article highlighting an emerging favorable seasonal trend for natural gas. This one fits neatly in the category of "if you write enough articles, occasionally one is going to blow up in your face." Natural gas remained in a brutal downtrend from start to finish, and there never seemed to be a solid entry point.
The bullish period just passed
The chart below displays the cumulative dollar return if holding a long position in natural gas futures from Trading Day of the Year (TDY) #184 through TDY #210 since natural gas started trading in 1990 through the end of 2021.
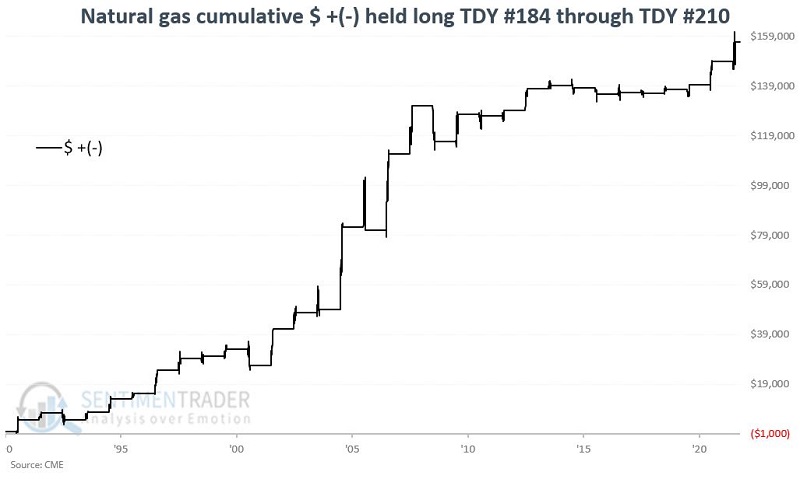
Pretty impressive, right? Maybe. At least until this year. This time around, natural gas plunged lower almost from start to finish. The chart below adds the return for natural gas during this period for 2022 to the equity curve above.
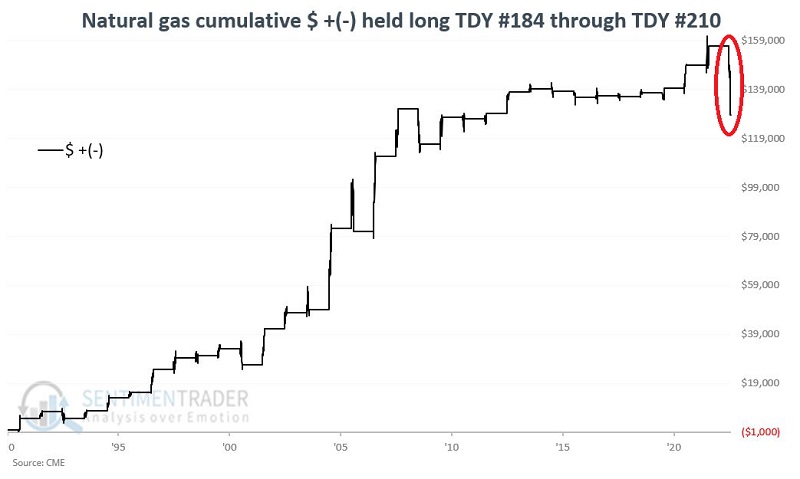
The worst previous loss for natural gas futures during this period was -$14,620 in 2008. In 2022 this period registered a cataclysmic decline of over -$28,000.
Repeating now: under no circumstances should a trader ever enter a trade (long or short) based solely on seasonality, refuse to enter a stop-loss, and simply plan to check back at the end of the favorable (or unfavorable) seasonal period. To do so invites disaster - as just demonstrated by natural gas above.
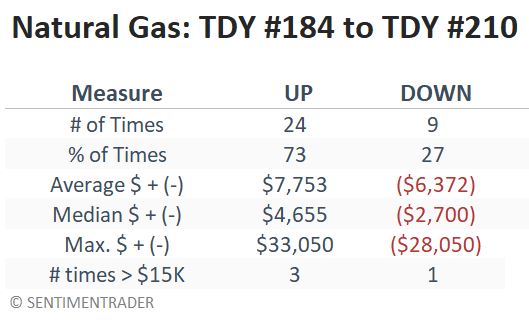
So, does this extraordinary loss invalidate the use of seasonality with natural gas? Well, that's up to each trader to decide. The overall results during the TDY #184 to #TDY 210 period appear in the table below. Overall, they are still pretty impressive, and I, for one, will be looking to consider a long trade in natural gas during this period in 2023. But only if I can find some confirmation at that time - from price action itself or from other indicators.
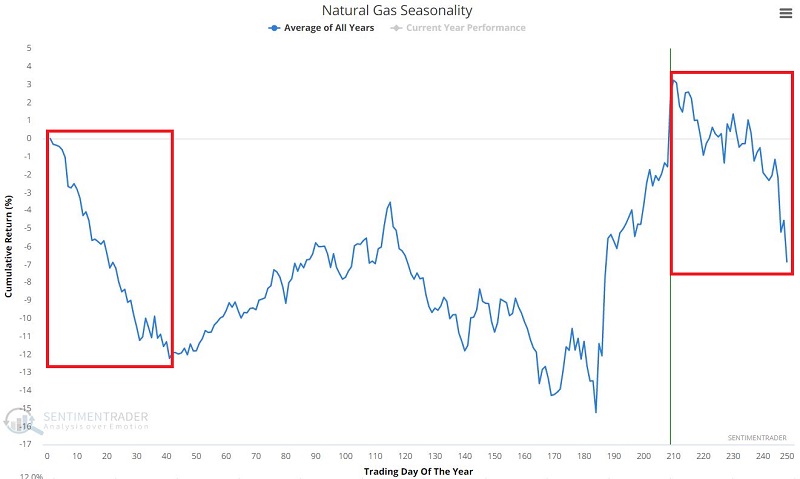
The bearish period is now upon us
Here's where the real conundrum comes in. Natural gas has experienced a massive collapse of over -50% in just under two months. We see this enormous decline in the chart below. We also see that RSI is extremely oversold and at a level that has often marked lows for natural gas.
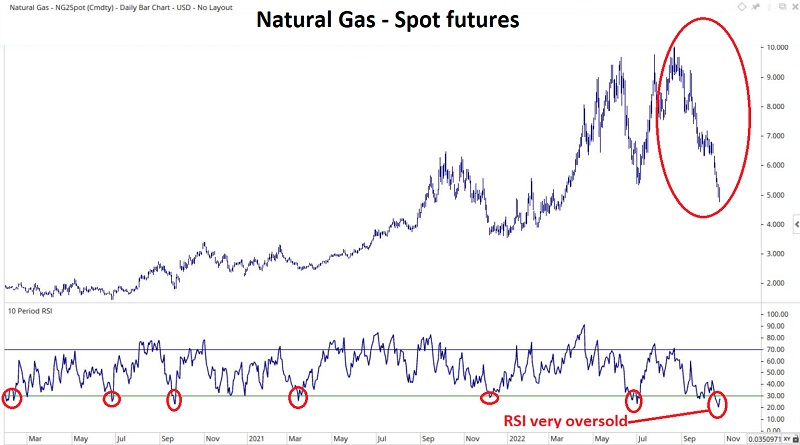
Conventional wisdom suggests a reflex rally of some sort is due. Still, as you can see in the chart below, the next significant bearish seasonal period has begun at the close of October 24 and will extend into late February 2023. So the questions for traders to ponder are:
- Can natural gas continue to decline?
- If I think "yes," should I sell short now or wait until after a bounce (to relieve the latest oversold condition?
- Or should I stand aside due to the extreme volatility in this market?
HINT: The "correct" answers to these questions will vary from trader to trader.
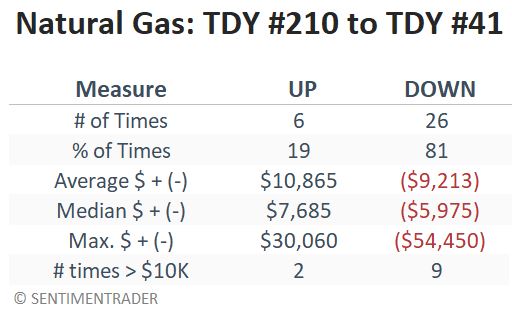
The chart below displays the cumulative $ +(-) for holding a long position in natural gas futures only from TDY #210 through TDY #41 the following year.
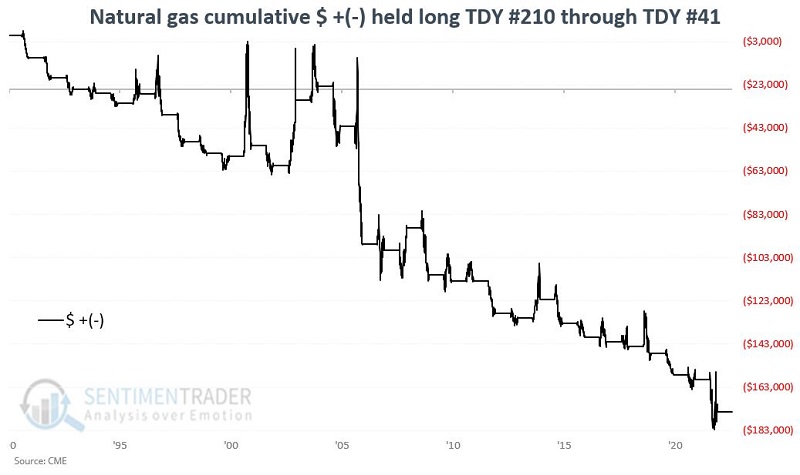
During these seasonal windows, natural gas declined during a whopping 26 out of 32 years.
Considering ETFs instead of futures contracts
Natural gas futures trading is only for very well-capitalized traders. On the other hand, ETFs can allow anyone to access the market. The United States Natural Gas Fund (UNG) is designed to track the price of natural gas futures. Like many commodity funds, it has a nasty long-term downward bias due to persistent contango in the futures market.
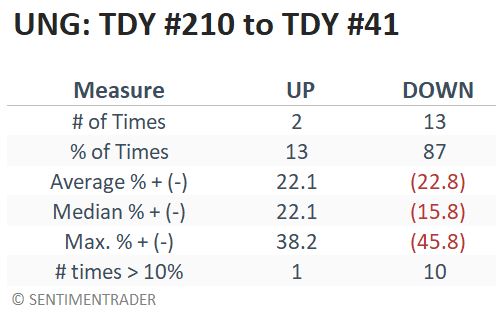
The chart below displays the cumulative percentage return for holding a long position in ticker UNG only from TDY #210 through TDY #41 the following year since trading inception in 2007. Note that the cumulative loss for this period is a stunning -97%.
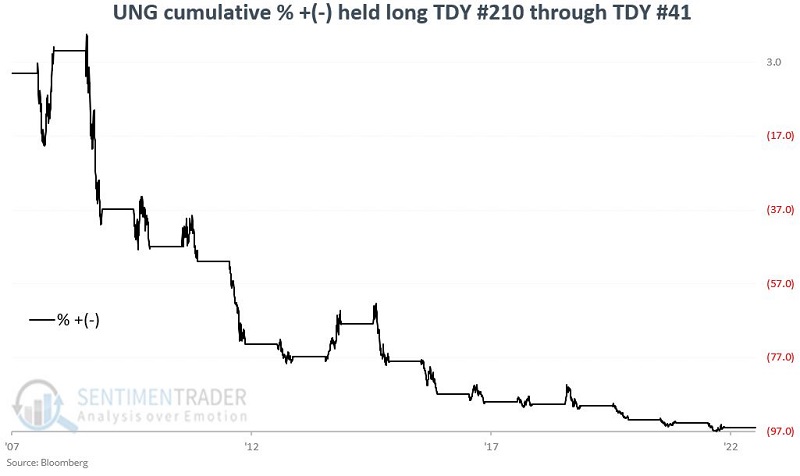
Out of the 15 years in its history, UNG suffered a loss during these seasonal windows 13 times, most of them for -10% or worse.
The ProShares UltraShort Bloomberg Natural Gas ETF (KOLD) is designed to track two times the inverse daily performance for natural gas futures. Make no mistake about the highly volatile and risky nature of investing in this ETF!
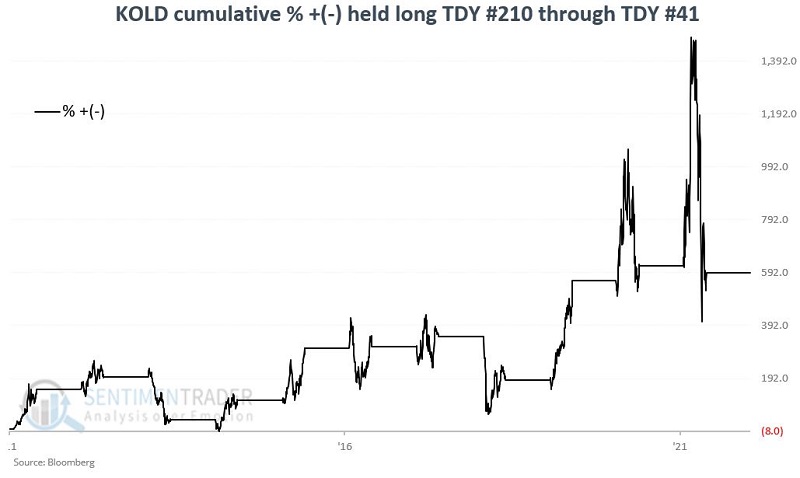
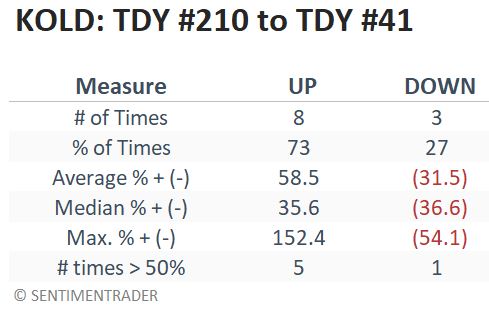
For better or worse, the chart and table below display the results for holding a long position in ticker UNG only from TDY #210 through TDY #41 the following year since trading inception in 2011. Over eleven years, the cumulative gain is +592%, albeit with many harrowing drawdowns.
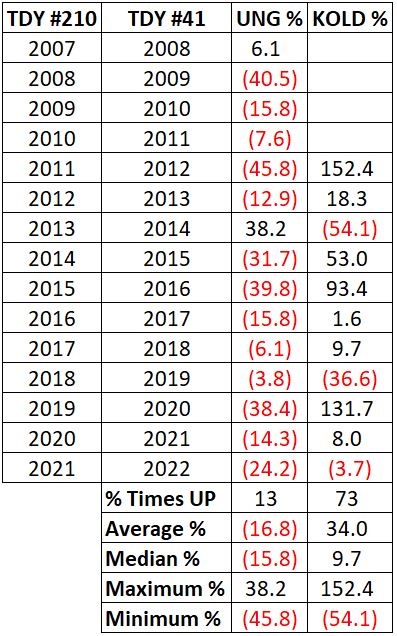
To illustrate the extremely high reward/high-risk nature of UNG and KOLD, the table below shows the year-by-year results for both UNG (long natural gas) and KOLD (short two times natural gas) during the TDY #210 through TDY #84 period. It also includes a summary of the performance of all years.
What the research tells us…
The research tells us to look for lower natural gas prices between now and late February 2023. How things will work out remains to be seen. With natural gas already beaten down substantially, playing the short side at this point certainly requires a leap of faith.
The real questions for traders are, "Do I want to play this situation?" and, if the answer to that question is yes, then "how will I play this situation?" Natural gas futures are likely to be quite volatile, and only well-capitalized traders should consider trading futures contracts. All others might consider a short position or a bearish options position in UNG, or a long position or a bullish options position in KOLD. Any position opened to play natural gas should be considered an extremely high-risk and speculative endeavor.