Products
SentimenTrader Trading Tools
‍
Backtest Engine
My Trading Toolkit
Correlation Analysis
Seasonality
Market Prediction
Indicators & Data API
‍
Proprietary Indicators & Charts
Market Data API
Strategies & Scanner
‍
50+ Trading Strategies
Smart Stock Scanner
Smart Option Scanner
Research Reports
‍
Research Solutions
Reports Library
Free Resources
Simple Backtest Calculator
Simple Seasonality Calculator
The Kelly Criterion Calculator
Sentiment Geo Map
Public Research Reports
Education
Sentiment Indicators
Technical Indicators
Pricing
Company
About
In the News
Testimonials
Client Success Stories
Contact
Log inLoginSign up
< BACK TO ALL REPORTS

The Nasdaq's momentum bubble is getting pricked

Jason Goepfert
2020-09-10
For the first time in months, there are signs that the Nasdaq's relentless momentum has become unglued.

Last week, we looked at other times the Nasdaq Composite formed major peaks. The index tended to go pretty much straight up into the peak then straight down afterward. There wasn't a lot of back-and-forth choppiness.

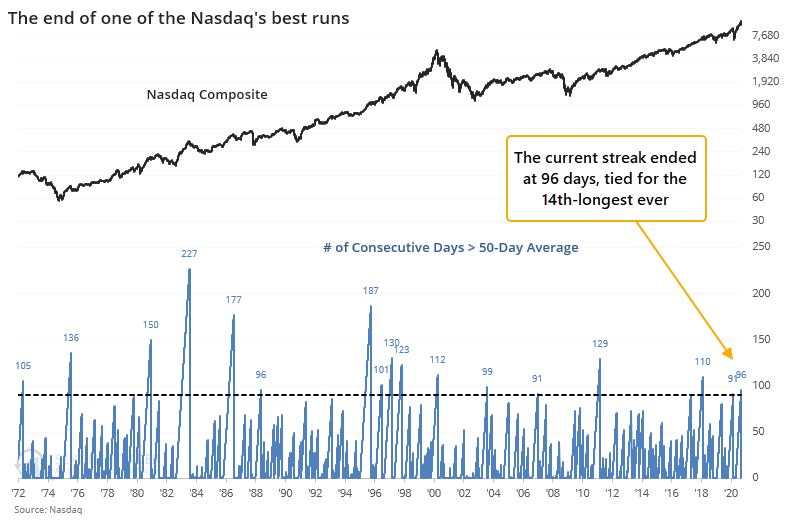
That's a bit of concern now because that's exactly what the index is doing, and it has set a new 10-day low which ended a couple of its other massive runs.

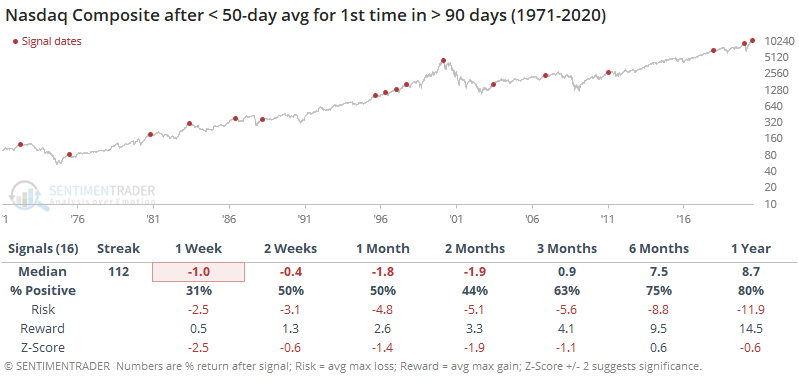
It has also finally dropped below its 50-day moving average for the first time in more than 90 days, ending one of the longer streaks since its 1971 inception.

Nasdaq streaks above 50 day moving average

The ends of other long streaks tended to lead to more short-term downside follow-through.

Nasdaq falls below 50 day average

There are other signs of waning momentum, like falling into correction territory in the fastest amount of time in history, and poor underlying breadth among stocks traded on that index.


This is an abridged version of our recent reports and notes. For immediate access with no obligation, sign up for a 30-day free trial now.

We also looked at:

  • What has happened after the fastest pullbacks of 10% in the Nasdaq's hitory
  • The Nasdaq's McClellan Oscillator and Summation Index are negative for the first time in months
  • What happens when the VXN "fear gauge" of implied volatility falls along with the Nasdaq 100
  • ETF traders pulled more than $2 billion from QQQ
  • Fear & Greed is falling back after one of the most extended runs in 20 years
  • Pessimism on the dollar is extreme, but that doesn't always mean a reversal
  • Oil has formed a Golden Cross
PRODUCTS
SentimenTrader
Trading Tools
Indicators & Data API
‍
Strategies & Scanner
‍
Research Reports
FREE
RESOUrCES
Simple Backtest
Calculator
Simple Seasonality
Calculator
The Kelly Criterion
Calculator
Sentiment Geo Map
‍
Public Research Reports
‍
Education
Sentiment Indicators
‍
Technical Indicators
‍
Pricing
Bundle pricing
‍
FAQ
‍
Announcements
‍
COMPANY
‍
About
‍
In the News
‍
Testimonials
‍
Client Success Stories
CONTACT
‍
General Inquiries
‍
Media Inquiries
‍
Financial Professionals Inquiries
‍
© 2026 Sundial Capital Research Inc. All rights reserved.
Setsail Marketing
TermsPrivacyAffiliate Program
Risk Disclosure: The information and tools provided are for research and analytical purposes only and are not intended as investment advice. Market analysis involves uncertainty, and outcomes may differ from expectations. Users should conduct their own due diligence and consider their individual circumstances before making any financial decisions. Past performance is not necessarily indicative of future results.

Hypothetical Performance Disclosure: Hypothetical performance results have many inherent limitations, some of which are described below. No representation is being made that any account will or is likely to achieve profits or losses similar to those shown; in fact, there are frequently sharp differences between hypothetical performance results and the actual results subsequently achieved by any particular trading program. One of the limitations of hypothetical performance results is that they are generally prepared with the benefit of hindsight. In addition, hypothetical trading does not involve financial risk, and no hypothetical trading record can completely account for the impact of financial risk of actual trading. for example, the ability to withstand losses or to adhere to a particular trading program in spite of trading losses are material points which can also adversely affect actual trading results. There are numerous other factors related to the markets in general or to the implementation of any specific trading program which cannot be fully accounted for in the preparation of hypothetical performance results and all which can adversely affect trading results.

Testimonial Disclosure: Testimonials appearing on this website may not be representative of other clients or customers and is not a guarantee of future performance or success.