Products
SentimenTrader Trading Tools
‍
Backtest Engine
My Trading Toolkit
Correlation Analysis
Seasonality
Market Prediction
Indicators & Data API
‍
Proprietary Indicators & Charts
Market Data API
Strategies & Scanner
‍
50+ Trading Strategies
Smart Stock Scanner
Smart Option Scanner
Research Reports
‍
Research Solutions
Reports Library
Free Resources
Simple Backtest Calculator
Simple Seasonality Calculator
The Kelly Criterion Calculator
Sentiment Geo Map
Public Research Reports
Education
Sentiment Indicators
Technical Indicators
Pricing
Company
About
In the News
Testimonials
Client Success Stories
Contact
Log inLoginSign up
< BACK TO ALL REPORTS

The Nasdaq quickly falls back into a correction

Jason Goepfert
2024-09-10
The Nasdaq Composite and Nasdaq 100 both suffered corrections in August, partially recovering during torrid rallies, then fell back into correction territory. This has not been a sign of smart money distribution. Rather, both indexes had a strong tendency to rebound in the months ahead, with almost exclusive gains over the next 6-12 months.

Key points:

  • The Nasdaq Composite suffered a correction, partially recovered, and then fell right back
  • The Nasdaq 100 index of larger tech stocks suffered the same fate
  • While assumed to be a sign of smart money distribution, multiple successive corrections actually preceded average returns

Successive corrections

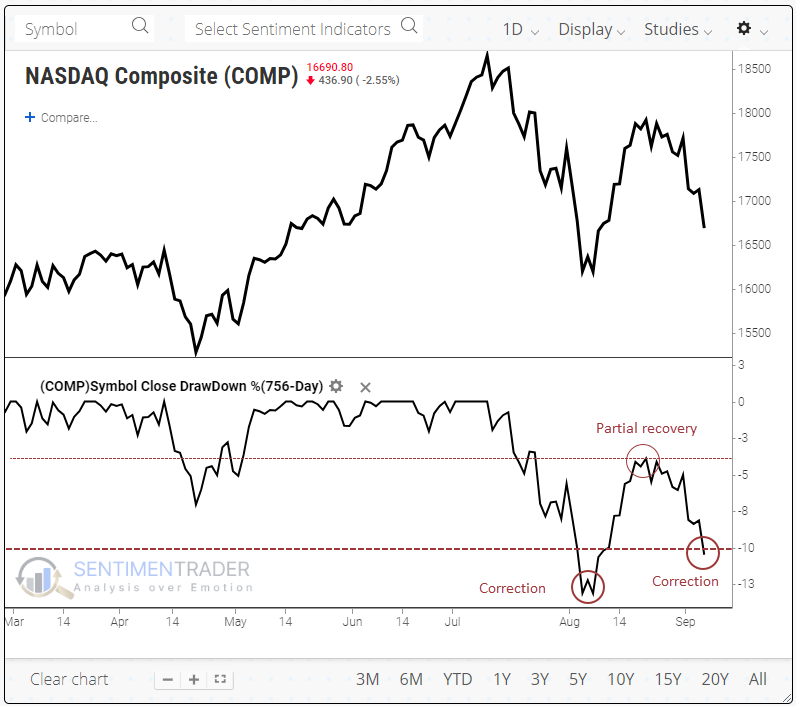
Near the end of August, stocks were amidst a torrid recovery, and investors started to assume that fresh all-time highs were around the corner.

Not so fast. Just as quickly as the gains materialized, they disappeared. Or much of them, anyway. The Nasdaq Composite made a roundtrip from correction territory to well within a pullback, back beyond a correction.

Due in part to the prevalence of post-nominal honorifics among technicians, it has become widely believed that this behavior is typical of market peaks. Multiple successive corrections are believed to represent smart money institutions offloading inventory to late-coming retail traders, culminating in a protracted decline as the latecomers realize their mistake and sell in a panic to the very institutions that sold to them in the first place.

That's the theory, and it's enticing.

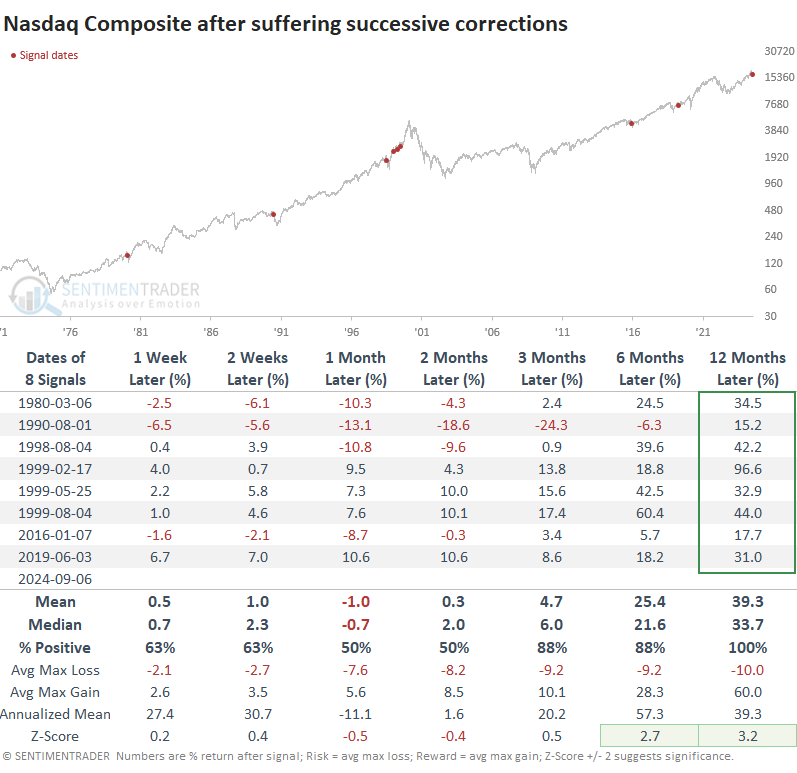
In practice, it's not so clear. In fact, it's pretty much wrong. It has preceded some significant peaks - well, one - but mostly, it led to recoveries. The table below shows every time the Nasdaq Composite was at least 10% from a multi-year peak (for convenience, we'll call this a correction). Then it recovered to within 4% of that peak and quickly fell back to more than 10% below. 

The first three times this occurred, the Composite lost at least another 10% over the next month before staging recoveries. Since then, it has rarely led to a decline in any time frame. Over the next year, the index sported double-digit gains every time.

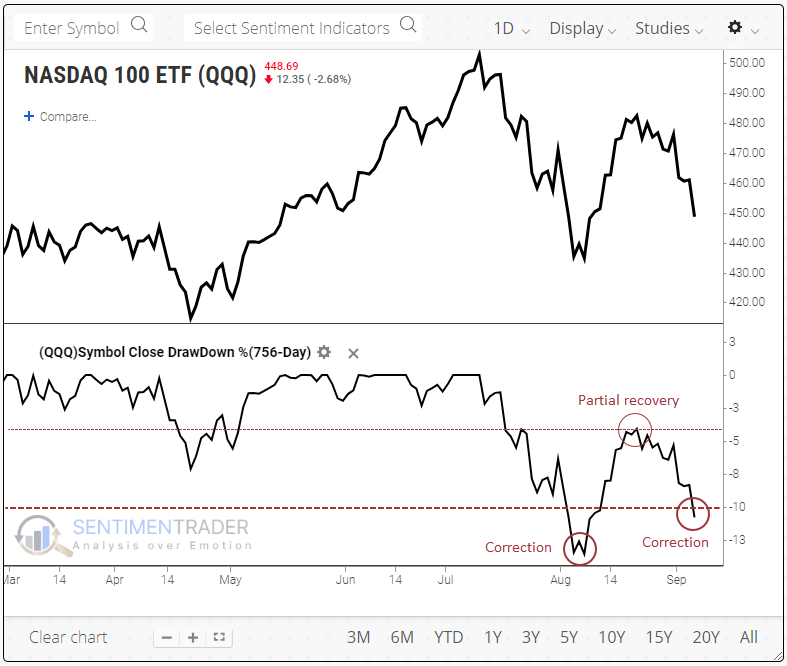
The NDX has suffered the same thing

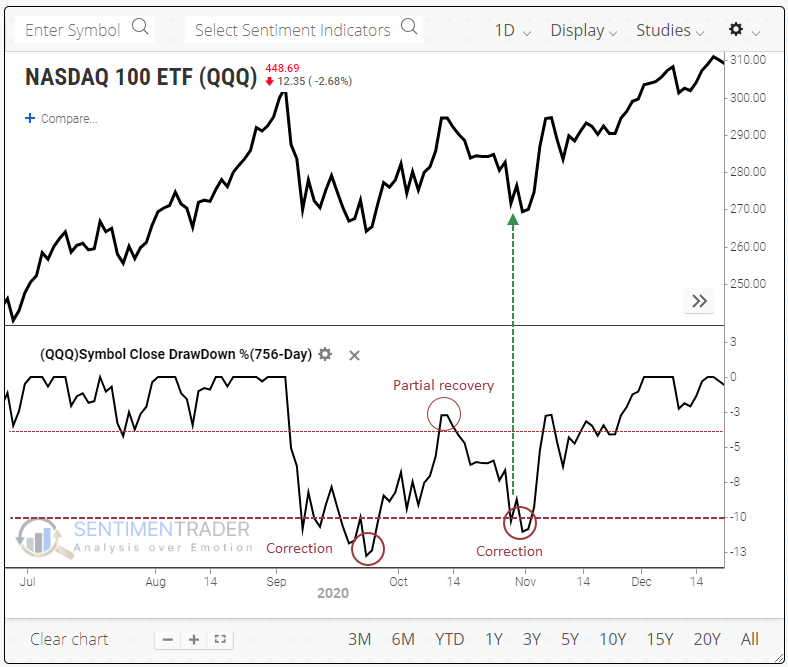
The Nasdaq 100 is more concentrated and often more volatile than the Composite. It shows a similar pattern: a -10% correction, recovery to within 4% of its high (rounded), and then a decline back into correction territory.

Because of that increased movement, the Nasdaq 100 has more often suffered repeat corrections. Over the next six months, the NDX showed gains after 11 out of 12 signals. That single loss was a doozy, however, as it coincided with the pricking of the internet bubble.

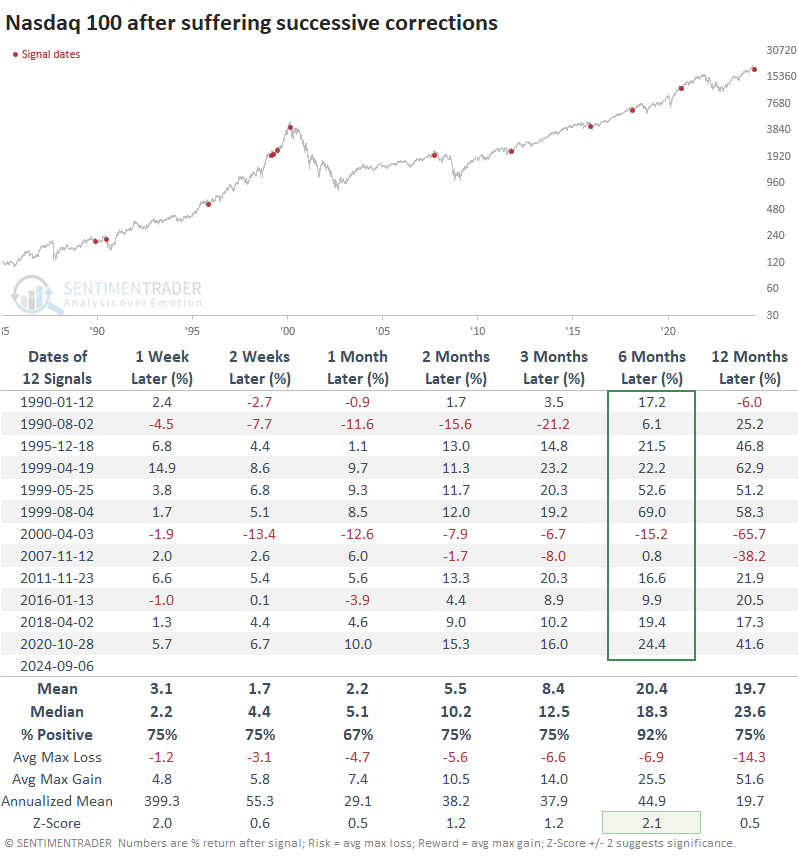
You might look at the chart above the table and think, "In 2020, that looks like a straight-up move with no corrections." However, when we zoom in, we can see that the pattern was similar, with a 10% correction, partial recovery, and then a quick drop back into a correction. That was about it for the selling pressure.

What the research tells us...

A common refrain in the stock market is that increased volatility at all-time highs is a sign of "smart money" distribution. There is some evidence that this is the case, but it depends on how it's measured.

If we're looking solely at the arbitrary definition of a correction when we see multiple ones in quick succession, it has not been a consistent sign of impending doom; quite the opposite, actually. While the risk/reward ratio of buying the 2nd correction wasn't all that great up to a couple of months later, longer-term returns were more compelling and consistently positive.

PRODUCTS
SentimenTrader
Trading Tools
Indicators & Data API
‍
Strategies & Scanner
‍
Research Reports
FREE
RESOUrCES
Simple Backtest
Calculator
Simple Seasonality
Calculator
The Kelly Criterion
Calculator
Sentiment Geo Map
‍
Public Research Reports
‍
Education
Sentiment Indicators
‍
Technical Indicators
‍
Pricing
Bundle pricing
‍
FAQ
‍
Announcements
‍
COMPANY
‍
About
‍
In the News
‍
Testimonials
‍
Client Success Stories
CONTACT
‍
General Inquiries
‍
Media Inquiries
‍
Financial Professionals Inquiries
‍
© 2026 Sundial Capital Research Inc. All rights reserved.
Setsail Marketing
TermsPrivacyAffiliate Program
Risk Disclosure: The information and tools provided are for research and analytical purposes only and are not intended as investment advice. Market analysis involves uncertainty, and outcomes may differ from expectations. Users should conduct their own due diligence and consider their individual circumstances before making any financial decisions. Past performance is not necessarily indicative of future results.

Hypothetical Performance Disclosure: Hypothetical performance results have many inherent limitations, some of which are described below. No representation is being made that any account will or is likely to achieve profits or losses similar to those shown; in fact, there are frequently sharp differences between hypothetical performance results and the actual results subsequently achieved by any particular trading program. One of the limitations of hypothetical performance results is that they are generally prepared with the benefit of hindsight. In addition, hypothetical trading does not involve financial risk, and no hypothetical trading record can completely account for the impact of financial risk of actual trading. for example, the ability to withstand losses or to adhere to a particular trading program in spite of trading losses are material points which can also adversely affect actual trading results. There are numerous other factors related to the markets in general or to the implementation of any specific trading program which cannot be fully accounted for in the preparation of hypothetical performance results and all which can adversely affect trading results.

Testimonial Disclosure: Testimonials appearing on this website may not be representative of other clients or customers and is not a guarantee of future performance or success.