Products
SentimenTrader Trading Tools
‍
Backtest Engine
My Trading Toolkit
Correlation Analysis
Seasonality
Market Prediction
Indicators & Data API
‍
Proprietary Indicators & Charts
Market Data API
Strategies & Scanner
‍
50+ Trading Strategies
Smart Stock Scanner
Smart Option Scanner
Research Reports
‍
Research Solutions
Reports Library
Free Resources
Simple Backtest Calculator
Simple Seasonality Calculator
The Kelly Criterion Calculator
Sentiment Geo Map
Public Research Reports
Education
Sentiment Indicators
Technical Indicators
Pricing
Company
About
In the News
Testimonials
Client Success Stories
Contact
Log inLoginSign up
< BACK TO ALL REPORTS

The Nasdaq finally sees a big positive breadth thrust

Jason Goepfert
2020-09-16
For the first time in nearly 6 months, there was a big positive thrust in Up Volume on the Nasdaq exchange.

Leave it to this market to be as perverse as possible.

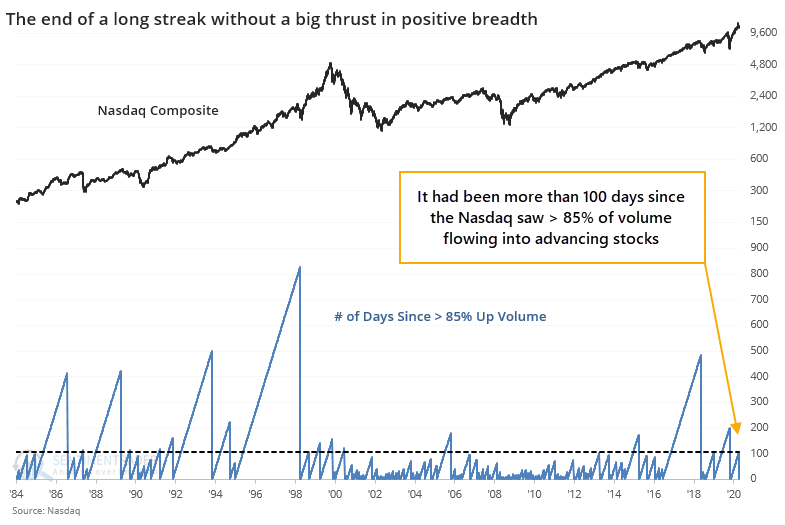
Just days after it became apparent that underlying momentum in the Nasdaq wasn't just deteriorating but was turning negative, it has one of the most broadly positive days in months with more than 85% of volume on the exchange flowing into advancing stocks.

Remarkably, it had been more than 100 days since more than 85% of any day's volume flowed into advancing stocks.

Nasdaq up volume ratio

The worry over the past couple of months has been that breadth was turning questionable, with a huge number of extremely odd readings, and those have historically not turned out well. Combined with signs of astounding speculation and a neutral-at-best market environment, the risk/reward outlook was poor. If we start to see continued thrusts in some of these breadth figures, it would offset a lot of those oddities from August and make the idea of sustained gains more palatable.


This is an abridged version of our recent reports and notes. For immediate access with no obligation, sign up for a 30-day free trial now.

We also looked at:

  • What happens when Up Volume surges AFTER the Nasdaq had already rallied strongly
  • Returns when Up Volume is > 85% for the first time in months and recently negative
  • The ratio of industrial stocks to the S&P 500 recently surged more than 10% in only 3 months
  • Equal-weight industrials have also surged relative to the equal-weight S&P
  • Nasdaq Fear/Greed shows some fear after big selloff
  • U.S. dollar sentiment is recovering from deep pessimism - what that has meant in the past
  • Value is finally outperforming growth
PRODUCTS
SentimenTrader
Trading Tools
Indicators & Data API
‍
Strategies & Scanner
‍
Research Reports
FREE
RESOUrCES
Simple Backtest
Calculator
Simple Seasonality
Calculator
The Kelly Criterion
Calculator
Sentiment Geo Map
‍
Public Research Reports
‍
Education
Sentiment Indicators
‍
Technical Indicators
‍
Pricing
Bundle pricing
‍
FAQ
‍
Announcements
‍
COMPANY
‍
About
‍
In the News
‍
Testimonials
‍
Client Success Stories
CONTACT
‍
General Inquiries
‍
Media Inquiries
‍
Financial Professionals Inquiries
‍
© 2026 Sundial Capital Research Inc. All rights reserved.
Setsail Marketing
TermsPrivacyAffiliate Program
Risk Disclosure: The information and tools provided are for research and analytical purposes only and are not intended as investment advice. Market analysis involves uncertainty, and outcomes may differ from expectations. Users should conduct their own due diligence and consider their individual circumstances before making any financial decisions. Past performance is not necessarily indicative of future results.

Hypothetical Performance Disclosure: Hypothetical performance results have many inherent limitations, some of which are described below. No representation is being made that any account will or is likely to achieve profits or losses similar to those shown; in fact, there are frequently sharp differences between hypothetical performance results and the actual results subsequently achieved by any particular trading program. One of the limitations of hypothetical performance results is that they are generally prepared with the benefit of hindsight. In addition, hypothetical trading does not involve financial risk, and no hypothetical trading record can completely account for the impact of financial risk of actual trading. for example, the ability to withstand losses or to adhere to a particular trading program in spite of trading losses are material points which can also adversely affect actual trading results. There are numerous other factors related to the markets in general or to the implementation of any specific trading program which cannot be fully accounted for in the preparation of hypothetical performance results and all which can adversely affect trading results.

Testimonial Disclosure: Testimonials appearing on this website may not be representative of other clients or customers and is not a guarantee of future performance or success.