Products
SentimenTrader Trading Tools
‍
Backtest Engine
My Trading Toolkit
Correlation Analysis
Seasonality
Market Prediction
Indicators & Data API
‍
Proprietary Indicators & Charts
Market Data API
Strategies & Scanner
‍
50+ Trading Strategies
Smart Stock Scanner
Smart Option Scanner
Research Reports
‍
Research Solutions
Reports Library
Free Resources
Simple Backtest Calculator
Simple Seasonality Calculator
The Kelly Criterion Calculator
Sentiment Geo Map
Public Research Reports
Education
Sentiment Indicators
Technical Indicators
Pricing
Company
About
In the News
Testimonials
Client Success Stories
Contact
Log inLoginSign up
< BACK TO ALL REPORTS

The Nasdaq Composite joins the all-time high club

Dean Christians
2024-03-01
For the first time in 569 days, the Nasdaq Composite closed at a record high, ending the 5th longest drought in history. The breakout represents the first precedent after a bear market. After similar signals, the composite displayed an 80% win rate a year later.

Key points:

  • The Nasdaq Composite closed at a new all-time high, marking the first instance after a 20% drawdown
  • Similar record highs for an index that contains a vast number of stocks preceded bullish outcomes
  • A timing system that compares the Nasdaq Composite to the S&P 500 continues to prefer the Nasdaq

Another broad composite joins the growing list of indexes recording an all-time high

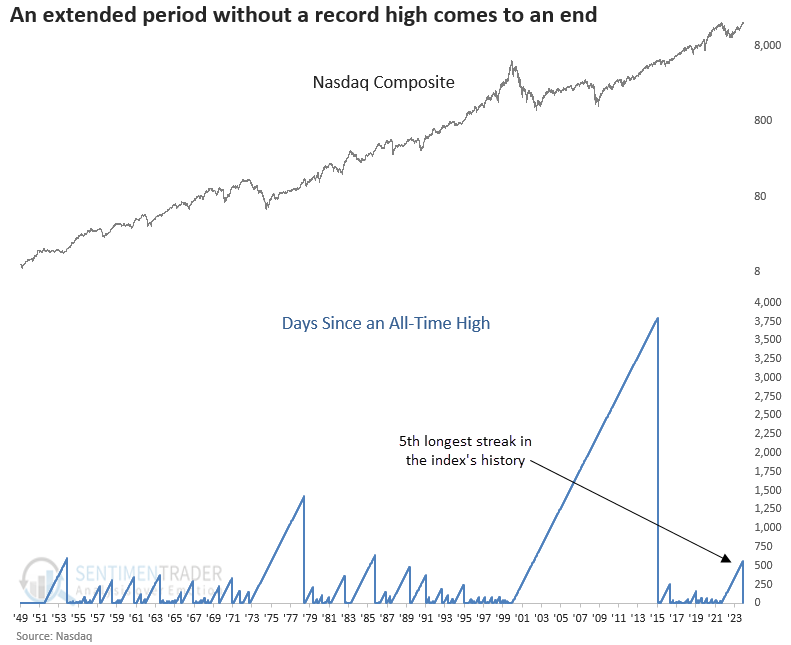
The NASDAQ Composite contains over 2500 domestic and international common-type stocks listed on The NASDAQ Stock Market, making it one of the most expansive indexes in the United States.

Thursday's trading session concluded with the index hitting a new all-time high, ending a 546-day drought without such a record and marking the first instance following a 20% drawdown. 

With the Nasdaq Composite joining other popular indexes like the S&P 500, Nasdaq 100, Dow Jones Industrial Average, and the NYSE Composite in the all-time high club, the stock market continues to exhibit bullish price action.

Similar record highs preceded a bullish outlook

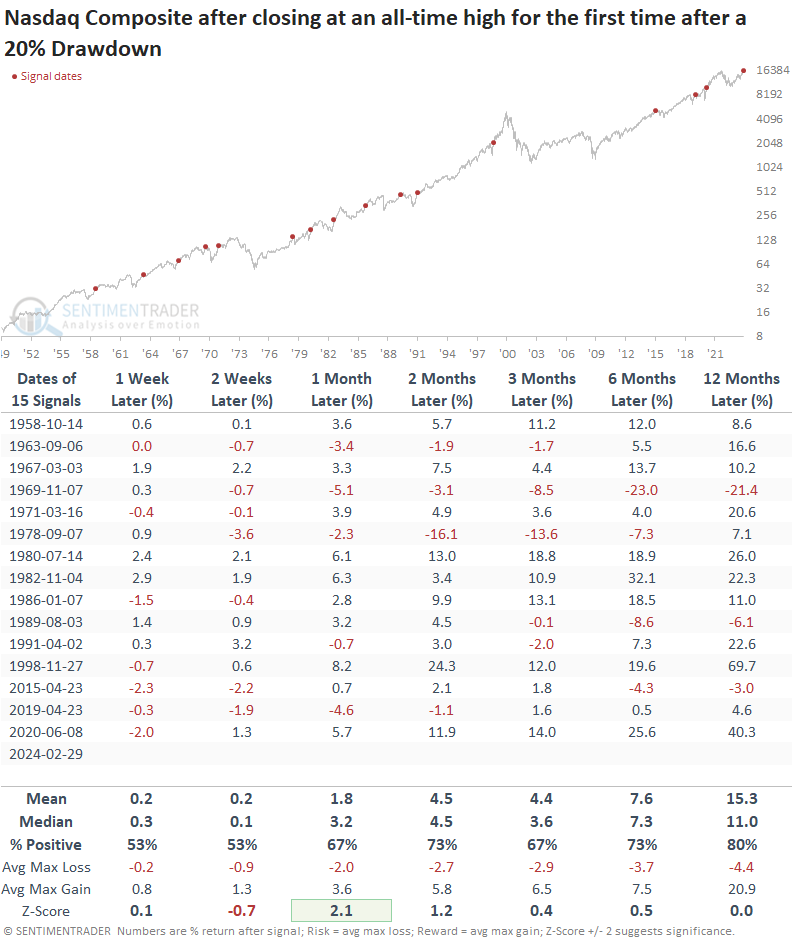
Once the Nasdaq Composite achieves an all-time high after a bear market, the broad-based index tended to sustain the positive momentum, showcasing an 80% win rate over the subsequent year. 

Bear markets promptly followed two instances, 1978 and 1969. The 1978 occurrence saw the composite decline -20.37% over 44 sessions, constituting a stealth bear. In the 1969 precedent, the situation was notably bleaker, with a decline of -36.74% over 136 sessions. 

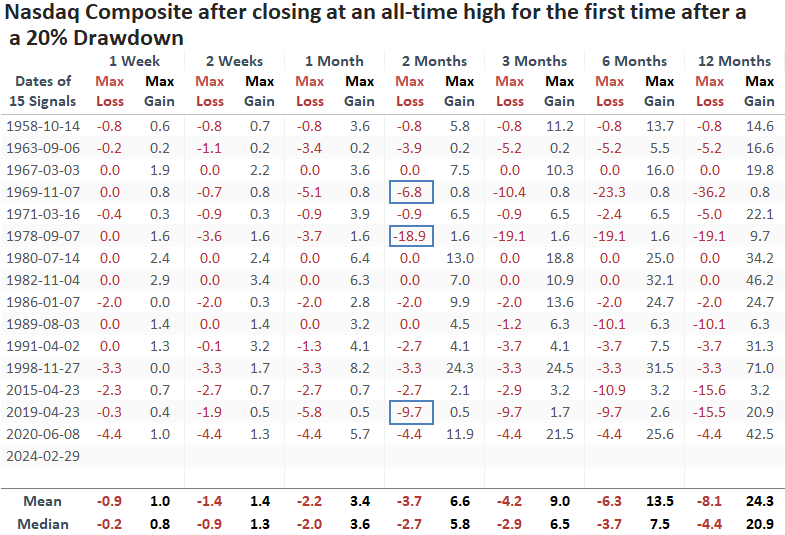
Over the subsequent two months, drawdowns were limited, with only 3 out of 15 displaying a max loss greater than -5%. 

Nasdaq Composite weightings

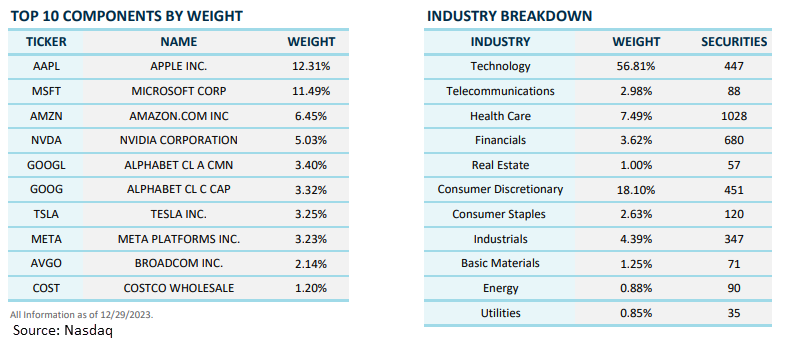
While sector weightings may vary over time, investors must remember that investing in the Nasdaq Composite today equates to a bet on Technology, with the industry accounting for 57% of the index.
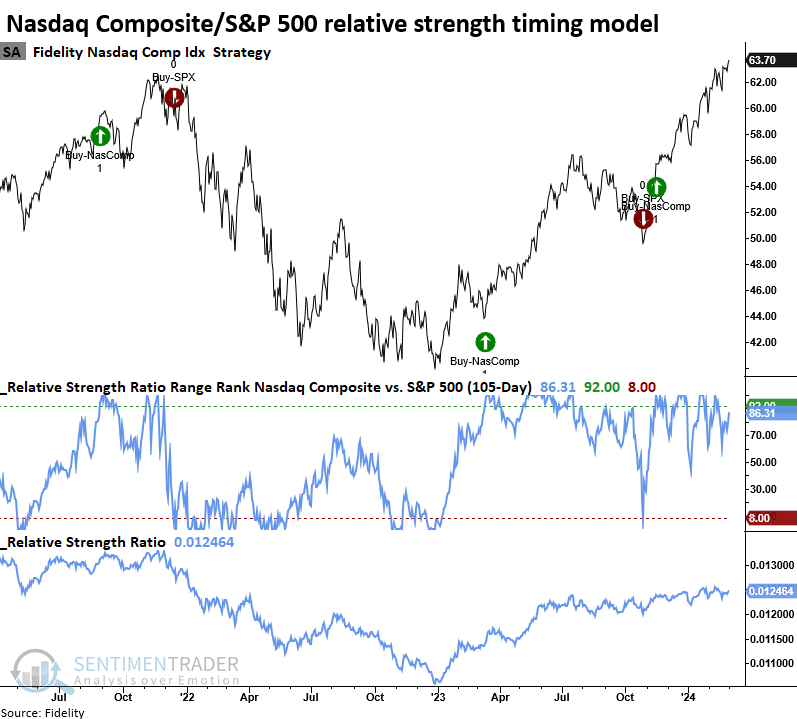
Relative Strength

The timing model I use to assess relative strength between the Nasdaq Composite and the S&P 500 continues to favor the Nasdaq. Our developers are currently programming this model along with several others, enabling subscribers to track relevant trends on the website's strategies page. Stay tuned.

What the research tells us...

In a notable market development, the Nasdaq Composite achieved a historic milestone by closing at a new record high, marking a significant recovery following a brutal bear market in 2022. This accomplishment signals a robust resurgence in the technology-heavy index, highlighting the resilience of Nasdaq stocks. The composite joined several popular indexes in record territory, underscoring broad market strength.

PRODUCTS
SentimenTrader
Trading Tools
Indicators & Data API
‍
Strategies & Scanner
‍
Research Reports
FREE
RESOUrCES
Simple Backtest
Calculator
Simple Seasonality
Calculator
The Kelly Criterion
Calculator
Sentiment Geo Map
‍
Public Research Reports
‍
Education
Sentiment Indicators
‍
Technical Indicators
‍
Pricing
Bundle pricing
‍
FAQ
‍
Announcements
‍
COMPANY
‍
About
‍
In the News
‍
Testimonials
‍
Client Success Stories
CONTACT
‍
General Inquiries
‍
Media Inquiries
‍
Financial Professionals Inquiries
‍
© 2026 Sundial Capital Research Inc. All rights reserved.
Setsail Marketing
TermsPrivacyAffiliate Program
Risk Disclosure: The information and tools provided are for research and analytical purposes only and are not intended as investment advice. Market analysis involves uncertainty, and outcomes may differ from expectations. Users should conduct their own due diligence and consider their individual circumstances before making any financial decisions. Past performance is not necessarily indicative of future results.

Hypothetical Performance Disclosure: Hypothetical performance results have many inherent limitations, some of which are described below. No representation is being made that any account will or is likely to achieve profits or losses similar to those shown; in fact, there are frequently sharp differences between hypothetical performance results and the actual results subsequently achieved by any particular trading program. One of the limitations of hypothetical performance results is that they are generally prepared with the benefit of hindsight. In addition, hypothetical trading does not involve financial risk, and no hypothetical trading record can completely account for the impact of financial risk of actual trading. for example, the ability to withstand losses or to adhere to a particular trading program in spite of trading losses are material points which can also adversely affect actual trading results. There are numerous other factors related to the markets in general or to the implementation of any specific trading program which cannot be fully accounted for in the preparation of hypothetical performance results and all which can adversely affect trading results.

Testimonial Disclosure: Testimonials appearing on this website may not be representative of other clients or customers and is not a guarantee of future performance or success.