Products
SentimenTrader Trading Tools
‍
Backtest Engine
My Trading Toolkit
Correlation Analysis
Seasonality
Market Prediction
Indicators & Data API
‍
Proprietary Indicators & Charts
Market Data API
Strategies & Scanner
‍
50+ Trading Strategies
Smart Stock Scanner
Smart Option Scanner
Research Reports
‍
Research Solutions
Reports Library
Free Resources
Simple Backtest Calculator
Simple Seasonality Calculator
The Kelly Criterion Calculator
Sentiment Geo Map
Public Research Reports
Education
Sentiment Indicators
Technical Indicators
Pricing
Company
About
In the News
Testimonials
Client Success Stories
Contact
Log inLoginSign up
< BACK TO ALL REPORTS

The Most Split S&P 500 In History

Jason Goepfert
2019-06-18
null

Split index

With the recent surge in stocks, more than 20% of them in the S&P 500 hit a 52-week high. But the percentage of stocks mired in a bear market, or at least 20% off their highs, hasn’t come down by much.

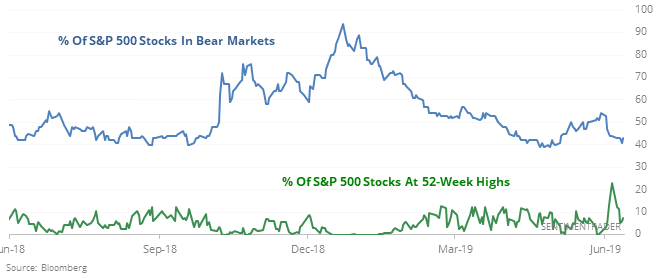
This leaves a split index, with a lot of stocks at either a new high, or in bear market territory. Split markets can highlight dangerous market conditions, like we saw near the end of 2017. The broader the split, the more dangerous they tend to be, though, and so far we’re not seeing anything like we did in late 2017 through early 2018.

On hold

Stocks surged off the early June low, with the S&P 500 jumping more than 5% in only a week. Since then, it has gone flat, without a move more than 0.5% for six straight days.

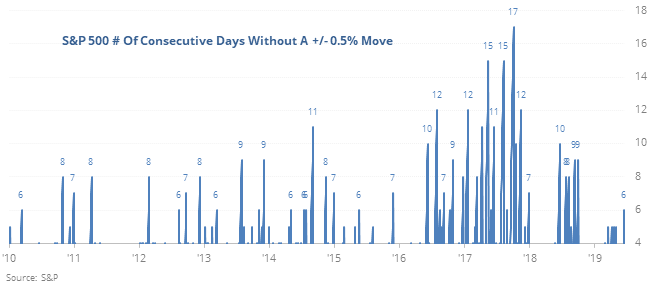
While this seems heavily influenced by the looming FOMC meeting, other times the index surged then went flat consistently led to further gains.

New model

Eric has posted a new model to the site, the Short-Term Combined Model. It is an ensemble model he built using machine learning methods, comprised of 14 shorter-term indicators that we track on the site. Annualized returns when above threshold are -16.0% versus +85.0% when below threshold. It has given some very interesting short-term signals, especially when spiking below -10. The 20-day average just curled up from below -6, which has had a very strong record of preceding gains.

This post was an abridged version of our previous day's Daily Report. For full access, sign up for a 30-day free trial now.

PRODUCTS
SentimenTrader
Trading Tools
Indicators & Data API
‍
Strategies & Scanner
‍
Research Reports
FREE
RESOUrCES
Simple Backtest
Calculator
Simple Seasonality
Calculator
The Kelly Criterion
Calculator
Sentiment Geo Map
‍
Public Research Reports
‍
Education
Sentiment Indicators
‍
Technical Indicators
‍
Pricing
Bundle pricing
‍
FAQ
‍
Announcements
‍
COMPANY
‍
About
‍
In the News
‍
Testimonials
‍
Client Success Stories
CONTACT
‍
General Inquiries
‍
Media Inquiries
‍
Financial Professionals Inquiries
‍
© 2026 Sundial Capital Research Inc. All rights reserved.
Setsail Marketing
TermsPrivacyAffiliate Program
Risk Disclosure: The information and tools provided are for research and analytical purposes only and are not intended as investment advice. Market analysis involves uncertainty, and outcomes may differ from expectations. Users should conduct their own due diligence and consider their individual circumstances before making any financial decisions. Past performance is not necessarily indicative of future results.

Hypothetical Performance Disclosure: Hypothetical performance results have many inherent limitations, some of which are described below. No representation is being made that any account will or is likely to achieve profits or losses similar to those shown; in fact, there are frequently sharp differences between hypothetical performance results and the actual results subsequently achieved by any particular trading program. One of the limitations of hypothetical performance results is that they are generally prepared with the benefit of hindsight. In addition, hypothetical trading does not involve financial risk, and no hypothetical trading record can completely account for the impact of financial risk of actual trading. for example, the ability to withstand losses or to adhere to a particular trading program in spite of trading losses are material points which can also adversely affect actual trading results. There are numerous other factors related to the markets in general or to the implementation of any specific trading program which cannot be fully accounted for in the preparation of hypothetical performance results and all which can adversely affect trading results.

Testimonial Disclosure: Testimonials appearing on this website may not be representative of other clients or customers and is not a guarantee of future performance or success.