
The most small-cap time of the year approaches

Key Points
- Small caps will soon enter their most favorable seasonal period of the year
- A particular window from mid-December into mid-February has tended to witness outperformance by small-cap stocks
- Large-cap stocks have historically dominated the rest of the year.
Test Periods and Data
We will focus on two seasonal periods, one favoring small-caps and the other large-caps.
- Period #1 extends from the close on the 11th trading day of December through the close on the 11th trading day of February. This period tends to favor small-caps.
- Period #2 extends from the close on the 11th trading day of February through the close on the 11th trading day of December. This period tends to favor large caps.
NOTE: The next Period #1 will begin on the close of trading on 2024-12-16 and will extend through the close on 2024-02-15.
We will use the Fama French small-cap and large-cap indexes from 1926 to 1991 and then the S&P small-cap and large-cap index after that. Our historical test period extends from 1926-12-13 through 2023-11-30.
Test Period #1: Favoring Small Caps
The chart below displays the growth of $1 invested in small-caps (black line) versus $1 invested in large-caps (blue line) only from the close on the 11th trading day of December through the close on the 11th trading day of February, every year starting in 1926.
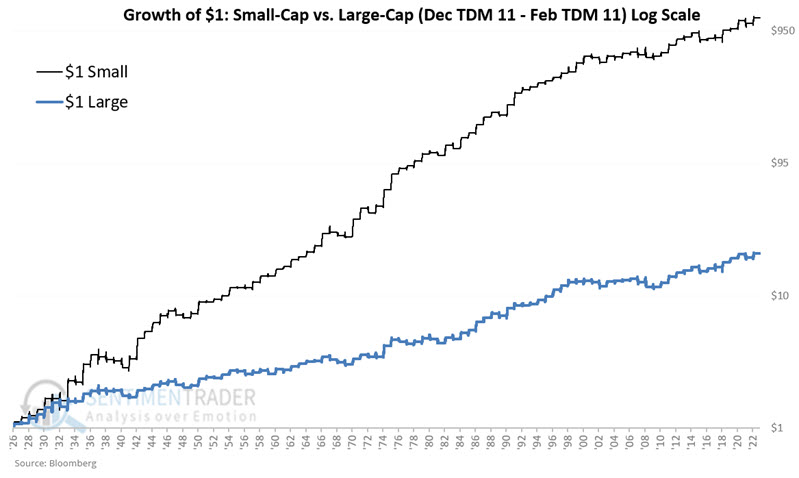
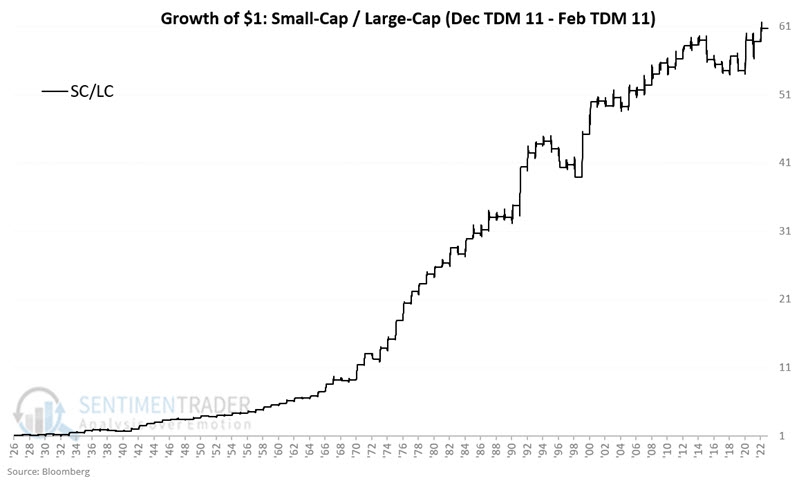
$1 in small-caps grew to $1,209 (+120,754%) versus $1 in large-caps increased to $20 (+1,894%). The chart below divides the growth of $1 in small caps by the growth of $1 in large caps during the mid-December into the mid-February period.
Lest anyone thinks that piling into small caps for the months ahead is a "sure thing," note that in the past 97 years, small caps have outperformed large caps 72 times during this seasonal window, or 74% of the time. This constitutes an "edge" but is nowhere close to a "sure thing."
Test Period #2: Favoring Large Caps
The chart below displays the growth of $1 invested in small-caps (black line) versus $1 invested in large-caps (blue line) only from the close on the 11th trading day of February through the close on the 11th trading day of December, every year starting in 1926.
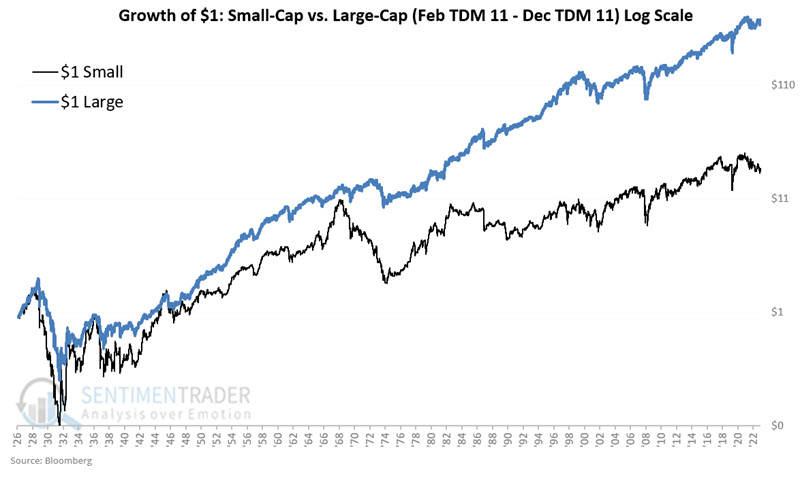
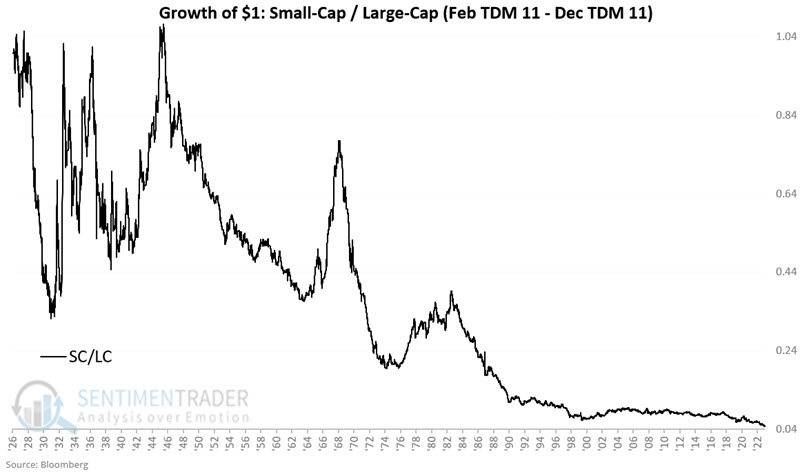
$1 in small caps grew to $21 (+2,006%), while $1 in large caps increased to $422 (+42,117%). The chart below divides the growth of $1 in small caps by the growth of $1 in large caps during the mid-December into the mid-February period.
A Switching Strategy versus doing the opposite
Let's examine a strategy that holds small-cap stocks during the Dec TDM #11 through Feb TDM #11 period and then switches to large-cap stocks during the Feb TDM #11 through Dec TDM #11 period. For comparison, we will also consider a strategy that does just the opposite (i.e., it holds large caps during the December into February period and small caps the rest of the year).
- $1 invested in the Switching Strategy grew to $506,433
- $1 invested 50/50 in Small and Large cap increased to $16,534
- $1 invested in the Opposite Strategy grew to $408
The chart below displays the growth of $1 invested using the Switching Strategy divided by $1 invested using buy-and-hold.
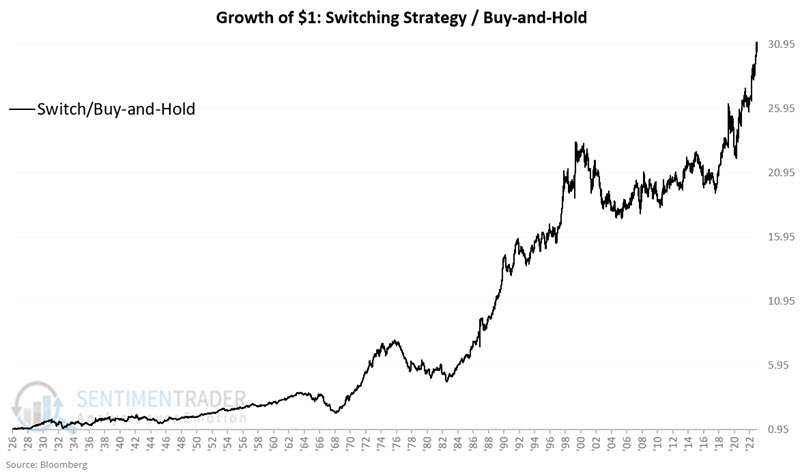
There are two key things to note. First, the long-term trend toward outperformance is unmistakable. However, regarding real-world trading realities, the second thing to note is that this ratio can go sideways to lower for years at a time. The danger here is that an investor who leans small-cap from Dec to Feb and large-cap the rest of the year may grow frustrated and abandon the approach - most likely just when it is about to start working again.
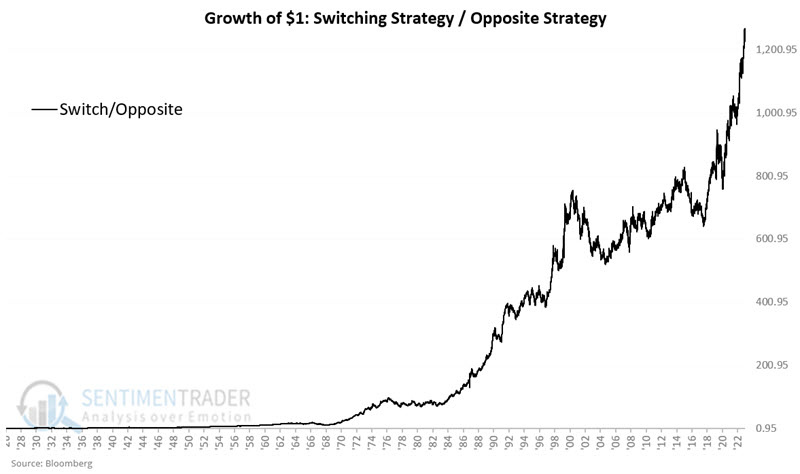
The chart below displays the growth of $1 invested using the Switching Strategy divided by $1 invested using the opposite strategy. While outperformance following the Switching Strategy is no sure thing, thumbing your nose at the tendency for small caps and large caps to perform better during different times of the year would historically have been a foolish thing to do.
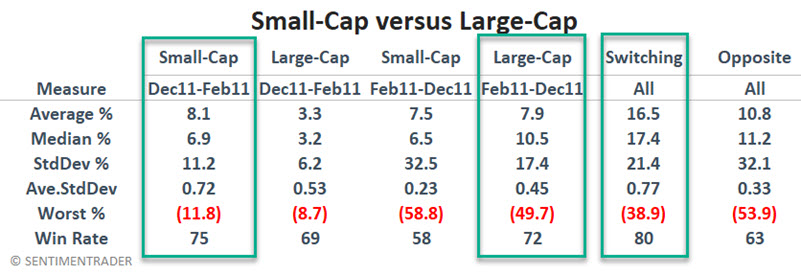
The table below summarizes small-cap and large-cap performance during the two seasonal periods. It also compares the performance of the Switching Strategy to a strategy that does just the opposite.
The green boxes highlight that small-caps outperformed from Dec TDM 11 to Feb TDM 11, large-caps outperformed during Feb TDM 11 to Dec TDM 11, and the Switching Strategy outperformed the Opposite Strategy.
What the research tells us…
The bad news first: There is no guarantee that the tendency for small caps to outperform mid-Dec to mid-Feb and for large caps to outperform the rest of the year will play out that way year-to-year. This can be highly frustrating. Likewise, there is no guarantee that the seasonal trends highlighted herein will continue ad infinitum into the future. With those caveats in mind, for the past century, there has been a clear edge associated with favoring one over the other based on the date showing on the calendar.
Each investor must decide how and to what extent to use knowledge of this edge. A mechanical approach that switches from 100% large-cap to 100% small-cap and back again based on the calendar probably only makes sense if only some portion of investment capital is allocated.