Products
SentimenTrader Trading Tools
‍
Backtest Engine
My Trading Toolkit
Correlation Analysis
Seasonality
Indicators & Data API
‍
Proprietary Indicators & Charts
Market Data API
Strategies & Scanner
‍
50+ Trading Strategies
Smart Stock Scanner
Research Reports
‍
Research Solutions
Reports Library
Free Resources
Simple Backtest Calculator
Simple Seasonality Calculator
The Kelly Criterion Calculator
Sentiment Geo Map
Public Research Reports
Pricing
Company
About
In the News
Testimonials
Client Success Stories
Contact
Log inLoginSign up
< BACK TO ALL REPORTS

The Midcap Power Period

Jay Kaeppel
2021-11-17
The stock market tends to perform well around market holidays. It also tends to perform well during the month-end/new-month period. In this piece, we highlight a strategy for taking advantage of this seasonal trend using mid-cap stocks.

Key Points

  • A specific nine trading day period near Thanksgiving has shown a tendency to be favorable for stocks
  • The best performing index during this period is the S&P 400 Midcap Index

The Mid-cap power period

The period we will examine is the 9-trading day period that extends:

  • From the close of the 7th to the last trading day of November
  • Through the close on the 3rd trading day of December

In plain English, we are talking about being long the S&P 400 Index during the last six trading days of November plus the first three trading days of December.

For 2021, this period will extend from:

  • The close on 11/19/2021   
  • Through the close on 12/3/2021

The history

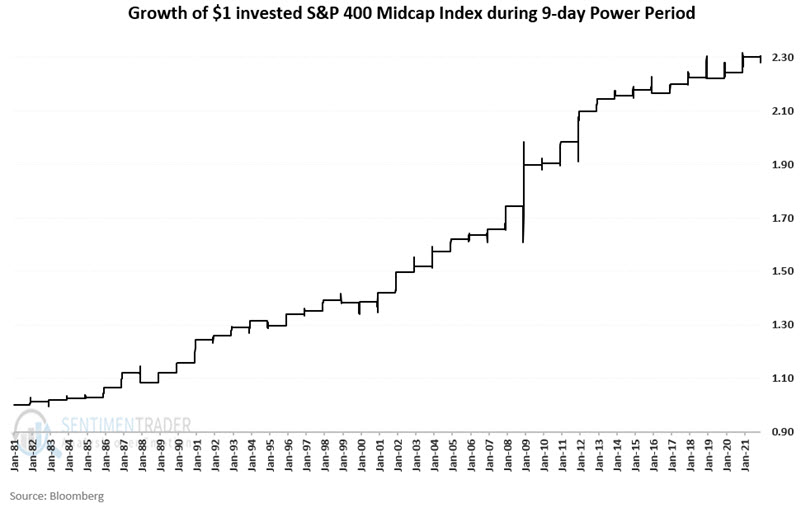
The chart below displays the cumulative growth of $1 invested in the S&P 400 Index (price-performance only) every year during the nine days described above since the index began in 1981.

The results

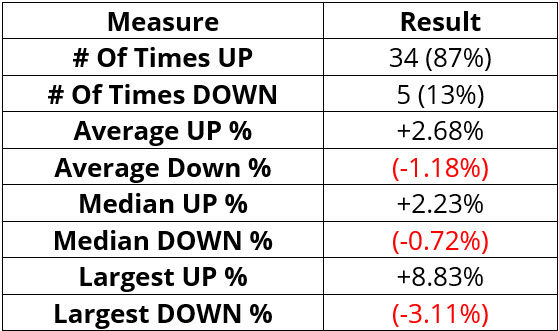
The table below displays the results of this test.

Traders can employ this strategy using ticker IJH (iShares Core S&P Mid-Cap ETF) or ticker MDY (SPDR S&P MIDCAP 400 ETF Trust) to track the S&P 400 Midcap Index.

What the research tells us…

  • The "holiday effect" combined with the "month-end effect" has been a consistently powerful combination for the S&P 400 Midcap Index
  • On a year-to-year basis, there is never a guarantee that this seasonal trend will see mid-cap stocks gain ground "this time around"
  • But a 39-year history with 87% winning trades and a 3-1 median profit-to-loss ratio does appear to offer an "edge" that some short-term traders may find compelling

Sorry, you don't have access to this report

Upgrade your subscription plan to get access
Go to Dasboard
PRODUCTS
SentimenTrader
Trading Tools
Indicators & Data API
‍
Strategies & Scanner
‍
Research Reports
FREE
RESOUrCES
Simple Backtest
Calculator
Simple Seasonality
Calculator
The Kelly Criterion
Calculator
Sentiment Geo Map
‍
Public Research Reports
‍
Pricing
Bundle pricing
‍
Announcements
‍
FAQ
COMPANY
‍
About
‍
In the News
‍
Testimonials
‍
Client Success Stories
CONTACT
‍
General Inquiries
‍
Media Inquiries
‍
Financial Professionals Inquiries
‍
© 2025 Sundial Capital Research Inc. All rights reserved.
Setsail Marketing
TermsPrivacyAffiliate Program
Risk Disclosure: Futures and forex trading contains substantial risk and is not for every investor. An investor could potentially lose all or more than the initial investment. Risk capital is money that can be lost without jeopardizing ones’ financial security or life style. Only risk capital should be used for trading and only those with sufficient risk capital should consider trading. Past performance is not necessarily indicative of future results.

Hypothetical Performance Disclosure: Hypothetical performance results have many inherent limitations, some of which are described below. No representation is being made that any account will or is likely to achieve profits or losses similar to those shown; in fact, there are frequently sharp differences between hypothetical performance results and the actual results subsequently achieved by any particular trading program. One of the limitations of hypothetical performance results is that they are generally prepared with the benefit of hindsight. In addition, hypothetical trading does not involve financial risk, and no hypothetical trading record can completely account for the impact of financial risk of actual trading. for example, the ability to withstand losses or to adhere to a particular trading program in spite of trading losses are material points which can also adversely affect actual trading results. There are numerous other factors related to the markets in general or to the implementation of any specific trading program which cannot be fully accounted for in the preparation of hypothetical performance results and all which can adversely affect trading results.

Testimonial Disclosure: Testimonials appearing on this website may not be representative of other clients or customers and is not a guarantee of future performance or success.