
The Mexican stock market has sparked a broad-based rally across the market.

Key Points:
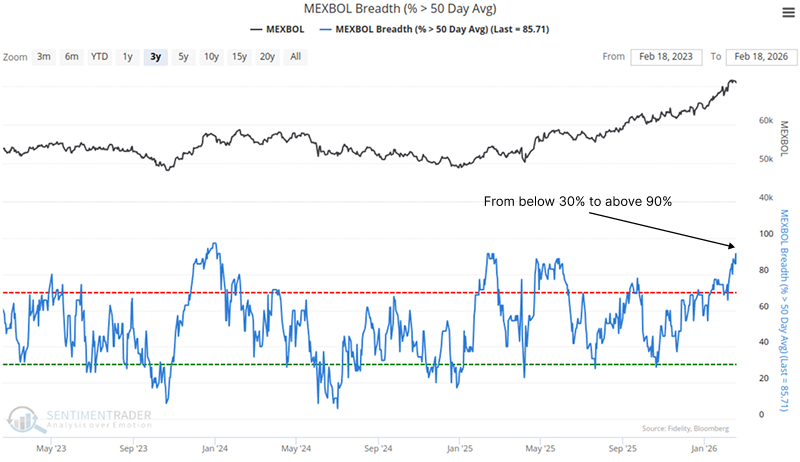
- The proportion of MEXBOL Index components trading above their 50-day moving average has cyclically risen from below 30% to above 90%
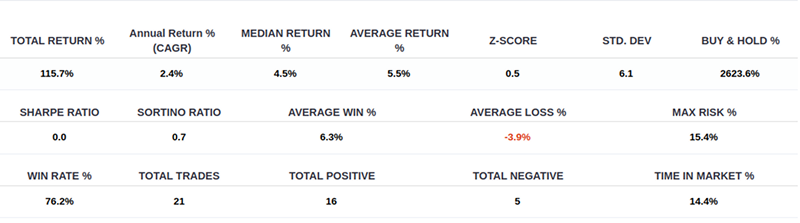
- Similar thrusts have delivered a 76.2% win rate for Mexico's benchmark index over subsequent 59-day holding periods
It is extremely useful to observe when the market exhibits counterintuitive movements relative to expectations
The proportion of stocks in the MEXBOL Index trading above their 50-day moving average has surged from below 30% to above 90%, reaching a new extreme level. This recovery in the medium-term trend of Mexico's bellwether stocks is particularly notable against a macro backdrop of implemented trade tariffs and tensions surrounding the United States-Mexico-Canada Agreement (USMCA) - factors that market participants typically view as negative. Typically, when a market or indicator rallies sharply amid adverse news, it signals that investors are looking past immediate risks and positioning for potential upside.
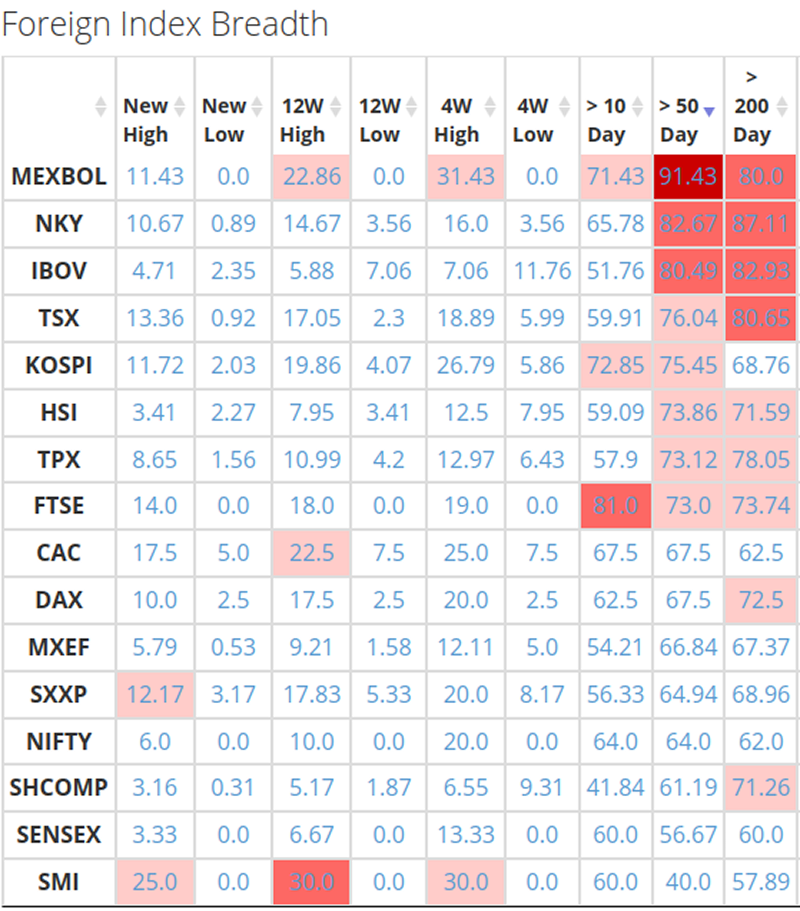
Subscribers can track global market breadth indicators directly on the dedicated page in the "Market Breadth" section. As shown in the table below, ranked by the percentage of stocks above their 50-day average, the MEXBOL Index leads with the highest number of constituents trading above their medium-term average.
Similar recoveries in participation signal bullish medium-term outlook
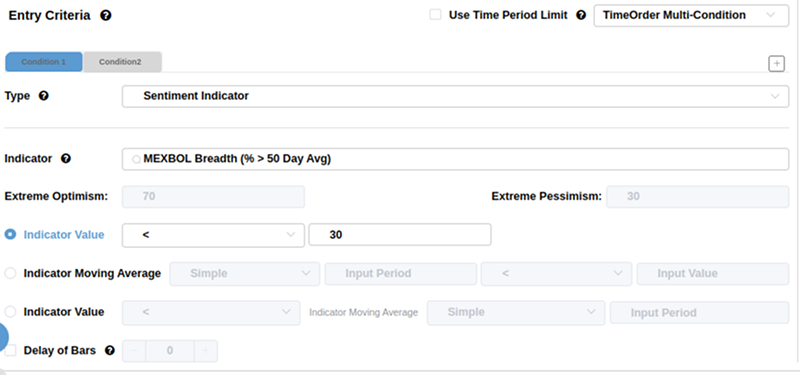
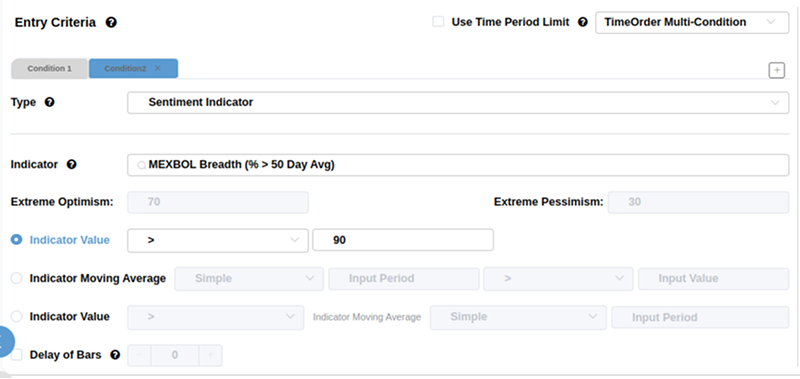
Using the multi-condition functionality of the backtesting engine, subscribers can seamlessly generate and track signals based on market breadth. For example, in today's report, I analyzed when the proportion of stocks in Mexico's stock exchange index trading above their 50-day average moved from below 30% to above 90%.
The research findings include a chart with green arrows marking signal dates, clearly illustrating historical occurrences. Click here to access the research report.
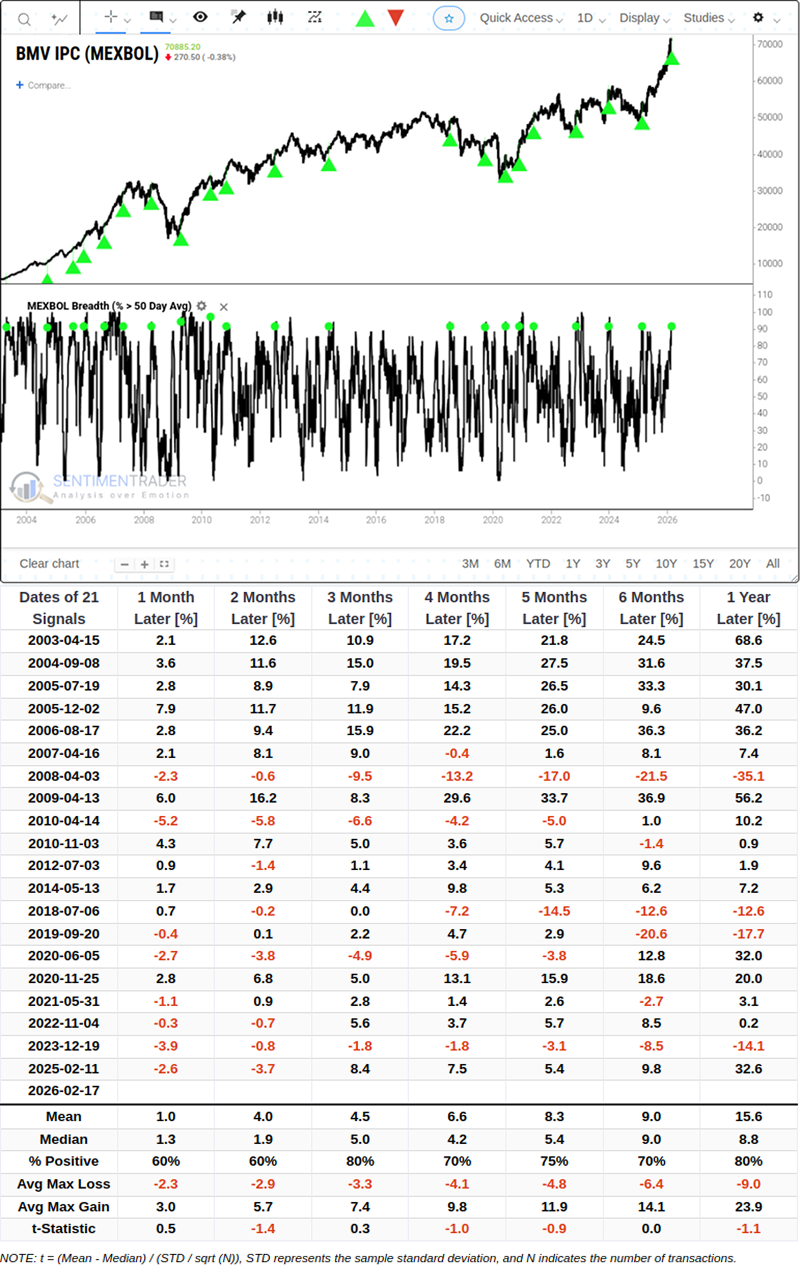
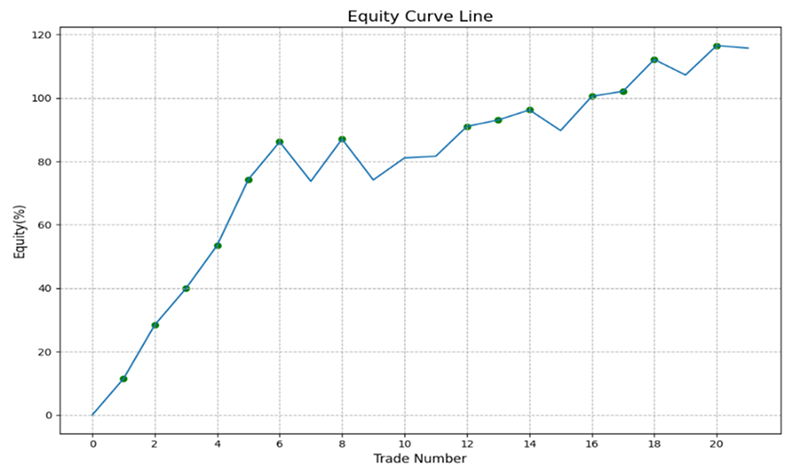
Optimization tests identified the optimal holding period for the Mexican Currency Index (MEXBOL Index) as 59 days. Under this condition, 16 out of 20 tests resulted in profits, representing a 76% win rate.
Analysis of historical performance across multiple timeframes indicates that Mexico's stock market index is likely to experience a pullback in the first week - a typical reaction following a bullish signal. However, the index has risen 80% of the time over the subsequent three months.
Empirically, the equity curve should gradually rise from the lower-left quadrant to the upper-right quadrant of the chart, and the bullish signals for the MEXBOL Index have largely achieved this pattern.
You can achieve this sequential signal trigger condition by following the settings below.
What the research tells us...
Mexico's benchmark stock index has soared, triggering a breadth rally signal when the proportion of components above their 50-day moving average jumped to over 90%. Historically, such upward momentum has been a strong indicator of sustained market gains, with the index having an 80% probability of continuing to rise over the next three months. When market movements contradict conventional wisdom, it often signals that something significant is unfolding.
Past performance is not indicative of future results.This analysis is based on statistical data and may be subject to statistical limitations, potentially failing to represent all market conditions. Investors should treat this signal as one of multiple reference indicators, exercise caution when making position allocation decisions, and avoid over-reliance on any single market breadth metric.