
The Macro Index Model meets crude oil and copper

Key points
- Our Macro Index Model continues to improve
- Crude oil and copper have shown a tendency to react in a particular manner to improvements in this model
- The sample size is so tiny that traders and investors should be careful about drawing conclusions - still, the results are compelling enough to warrant a closer look
The latest trend in the Macro Index Model
Our Macro Index Model combines 11 diverse economic indicators to determine the state of the U.S. economy right now. The good news is that - despite the steady drumbeat of economic gloom and doom among many pundits - the index has improved considerably in recent months. The bad news is that the latest reading remains below 0.70, our cutoff for "favorable" versus "unfavorable" readings for the economy and the stock market.
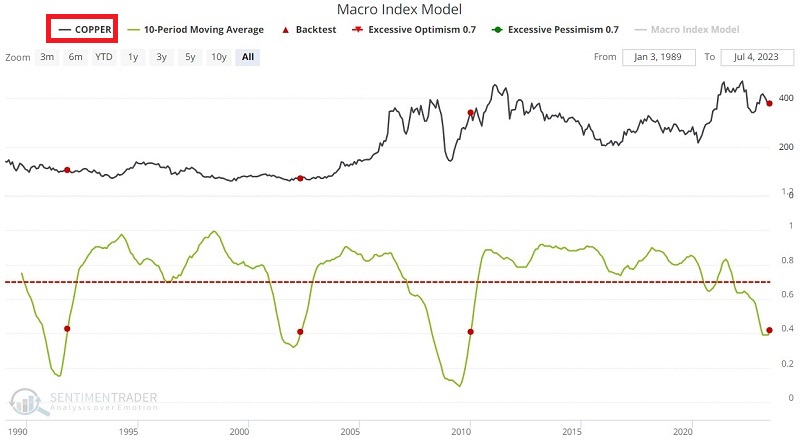
The chart below displays the Macro Index Model (MIM) and its 10-month moving average. The latest reading is 0.636, up from its recent low of 0.273 five months ago. The 10-month moving average just crossed back above 0.40 and stands at 0.42.
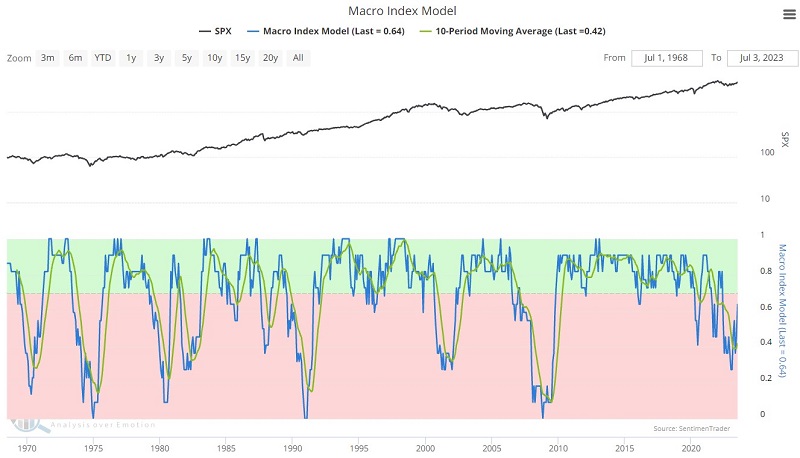
This cross above 0.40 triggers some interesting anomalies - although each trader must decide whether it truly has meaning.
A closer look at crude oil
The chart and table below display crude oil performance following those rare occasions when the MIM 10-month average crossed from below 0.40 to above 0.40. 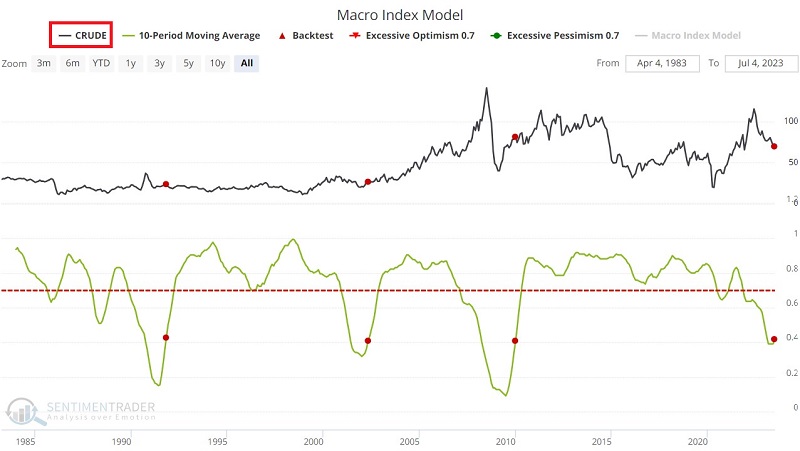
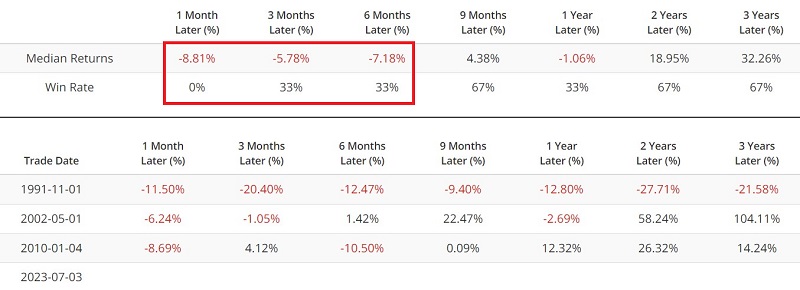
The theoretical implications are pretty straightforward. Crude oil has tended to struggle mightily one to six months after a signal. The problem is that there have only been three previous signals before the most recent one on 2023-07-03. So, one can absolutely question the statistical significance of the earlier results and whether or not there will be any impact this time.
One factor that might potentially buttress a less-than-optimistic outlook for crude oil is the annual seasonal trend for crude oil futures in the chart below. Crude oil has a long history of struggling - and then ultimately declining - during the second half of the calendar year.
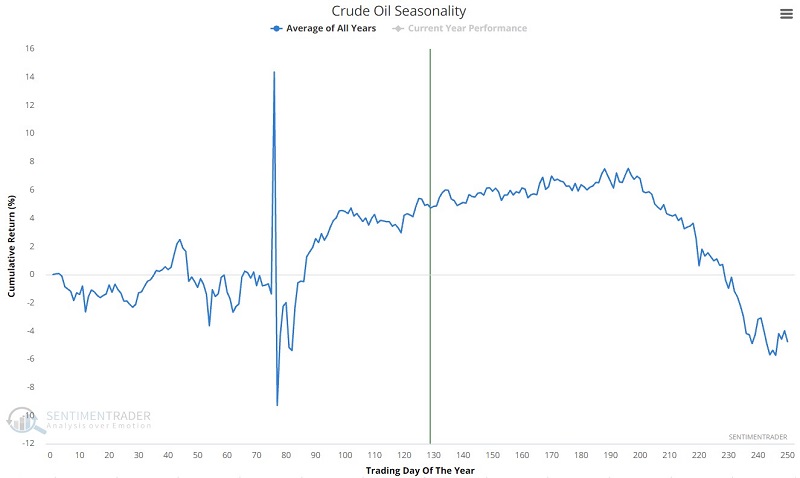
Given the current combination of macro and seasonality, the message here is perhaps not that traders should presently be piling into the short side of crude oil but rather that they should be watching closely for an opportunity to play the short side.
A closer look at copper
The chart and table below display copper following those occasions when the MIM 10-month average crossed from below 0.40 to above 0.40.
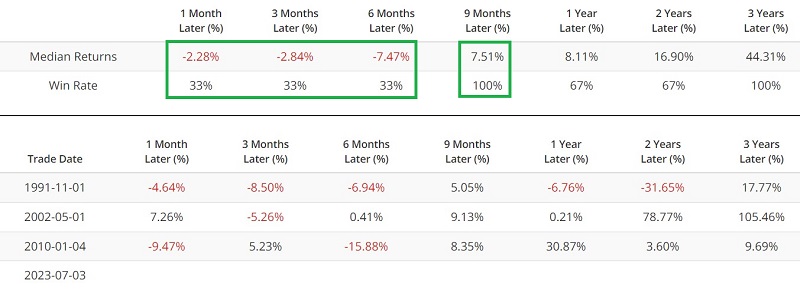
Copper has also tended to struggle mightily one to six months after a signal. It also has experienced another weird quirk between 6 and nine months after previous alerts. The same caveat of a small sample size applies here. That said, following the last three signals, copper experienced some notable declines during the first six months.
The odd anomaly is that following the three previous signals, copper rallied sharply during the six months after a signal to 9 months after a signal period, as highlighted below.
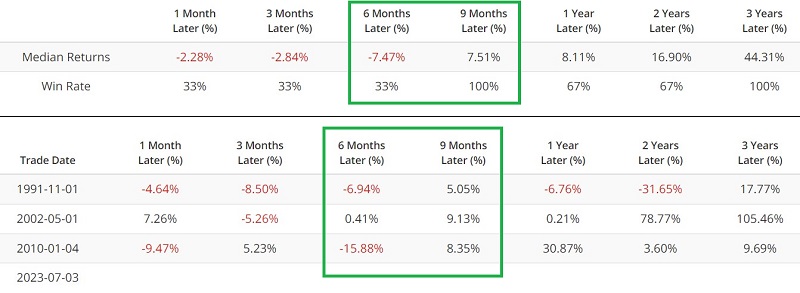
Does this mean that copper is doomed to struggle between now and 2024-01-03? And then rally sharply from there until 2024-04-03? Not at all. But history suggests that traders look for potential opportunities that follow those trends. Like crude oil, copper has shown significant seasonal weakness during the second half of the calendar year - and seasonal strength during the first part of a new year.
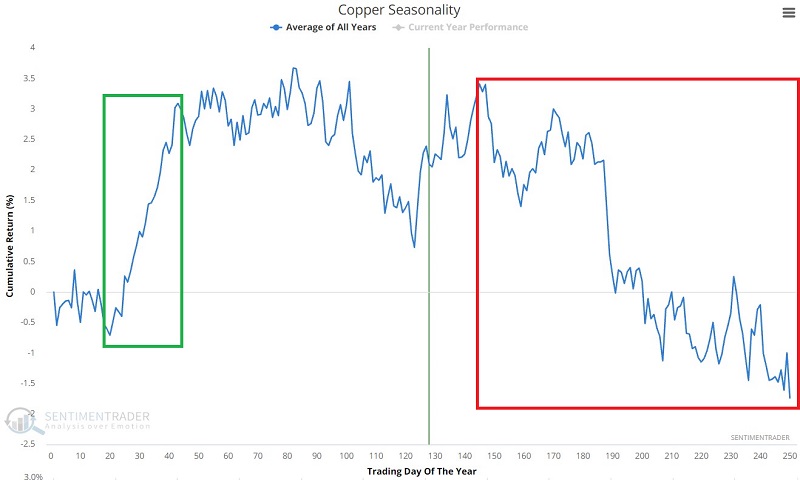
As with crude oil, the recent cross above 0.40 by the MIM 10-month average should likely not be viewed as a "call to action" but rather as a "call to pay close attention and to jump on a trend if it begins to unfold as expected."
What the research tells us…
It bears repeating: a sample size of three should not be relied upon as a "trading system" or a "trading signal." Many factors impact the prices of crude oil and copper, and the results displayed above should not convince you that crude and/or copper are doomed to fall in the months ahead. That said, trading is a game of odds. The results following previous MIM crosses above the 10-month 0.40 level - combined with the strongly unfavorable seasonal tendencies for both markets in the months ahead - suggest that traders actively seek opportunities to trade the short side of these two important commodity markets.