
The Macro Index Model favors the S&P 500 over Crude Oil

Key points
- The Macro Index Model (MIM), which aggregates 11 key economic indicators, has crossed above the 0.6 threshold, signaling a low recession probability.
- Historically, when the MIM crosses above 0.6 while the S&P 500 is in a long-term uptrend, equity returns have been consistently positive, achieving a 100% win rate over six months.
- However, this same economic resilience signal has historically been a headwind for crude oil in the medium term.
The Macro Index Model
Our Macro Index Model (MIM) combines 11 various economic indicators to determine the state of the U.S. economy right now. Including:
- New Home Sales
- Housing Starts
- Building Permits
- Initial Claims
- Continued Claims
- Heavy Truck Sales
- 10-year - 3-month Treasury yield curve
- S&P 500 vs. its 10-month moving average
- ISM manufacturing PMI
- Margin debt
- Year-over-year headline inflation
The model is constructed as an inverse of recession probability. So, you can subtract the model from 100% to get the recession probability in the months ahead. A model reading of 70% suggests a 30% recession probability; a reading of 20% suggests an 80% recession probability.
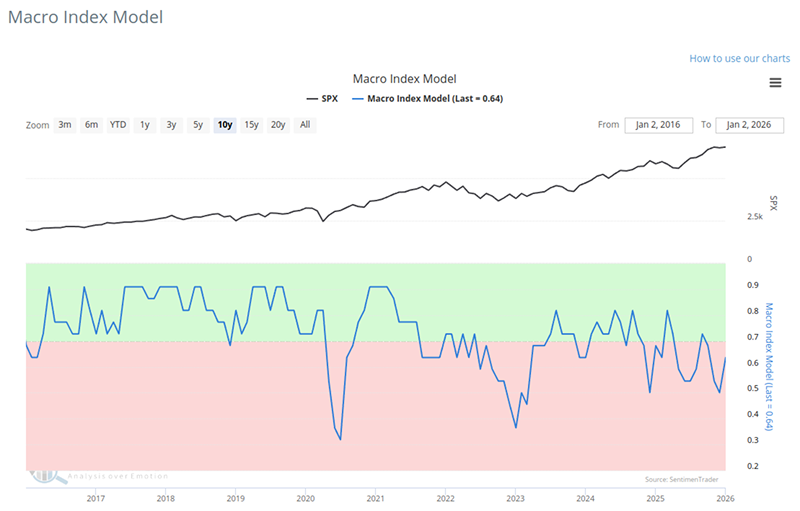
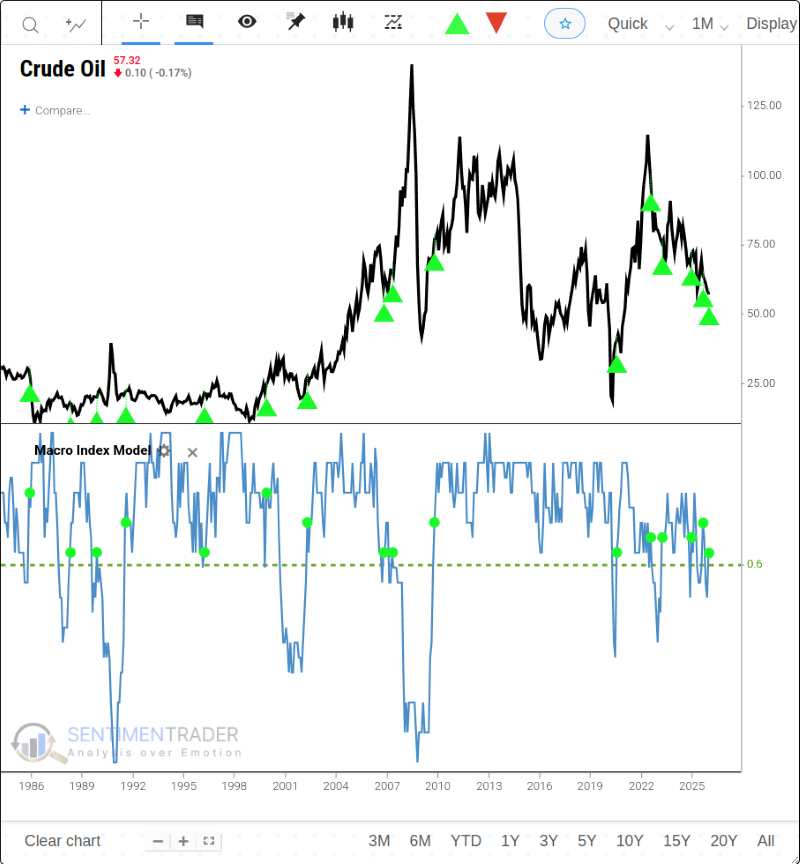
Returns were robust when the model was above 50%, and terribly subpar when it was 50% or below. The latest reading is 0.636. The model recently generated a "Golden Cross" by moving above 0.6. The chart below highlights the dates when the MIM crossed above the 0.6 level. For related backtest, click here.
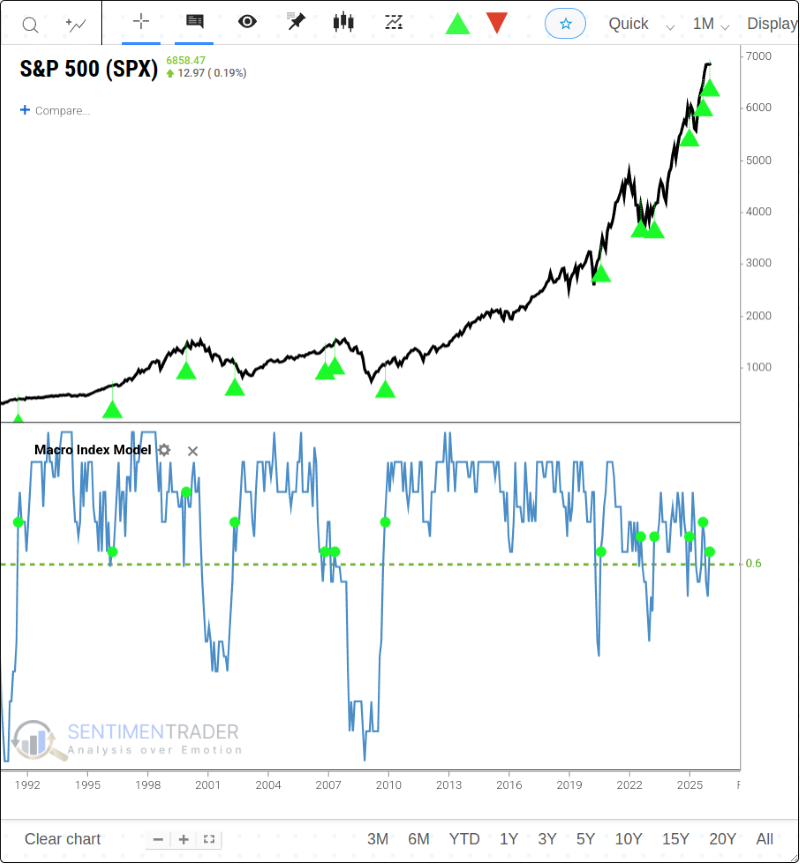
As you can see, performance has been relatively strong across various timeframes.
MIM signals when S&P 500 is trending up
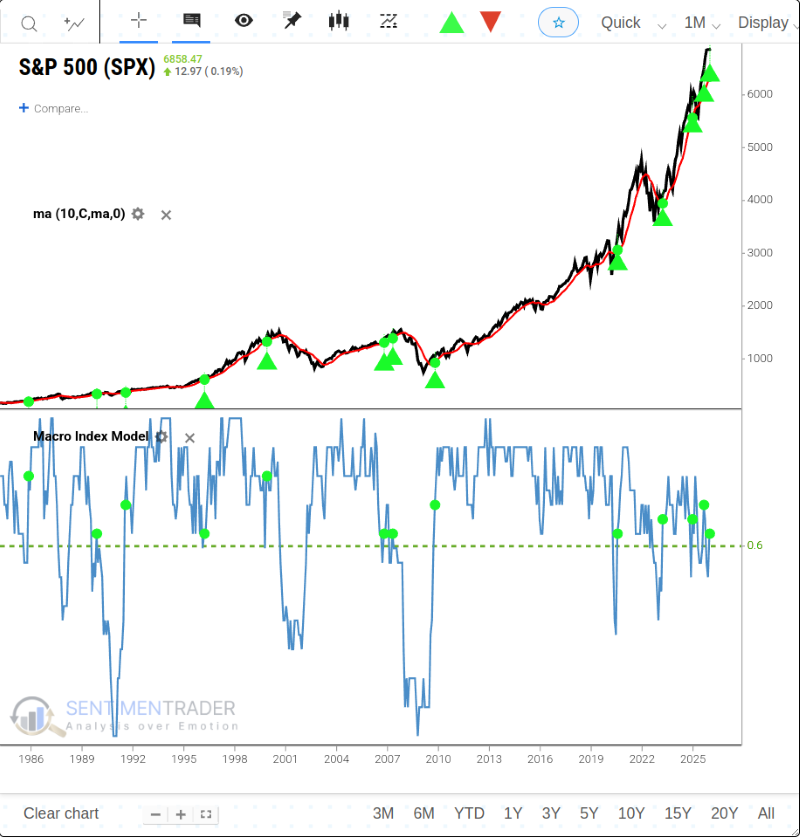
To refine the signal further, we added a filter requiring the S&P 500 to be above its 10-month moving average, ensuring that the primary market trend is positive.
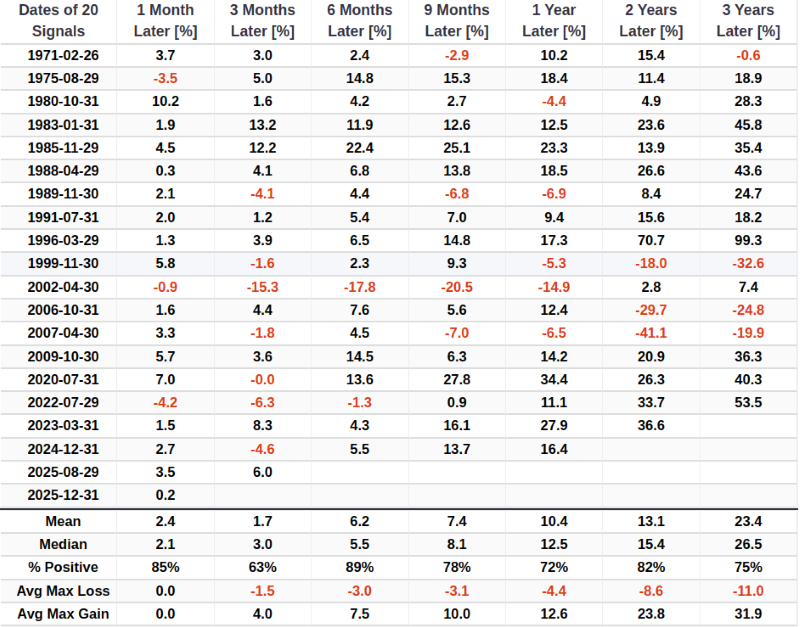
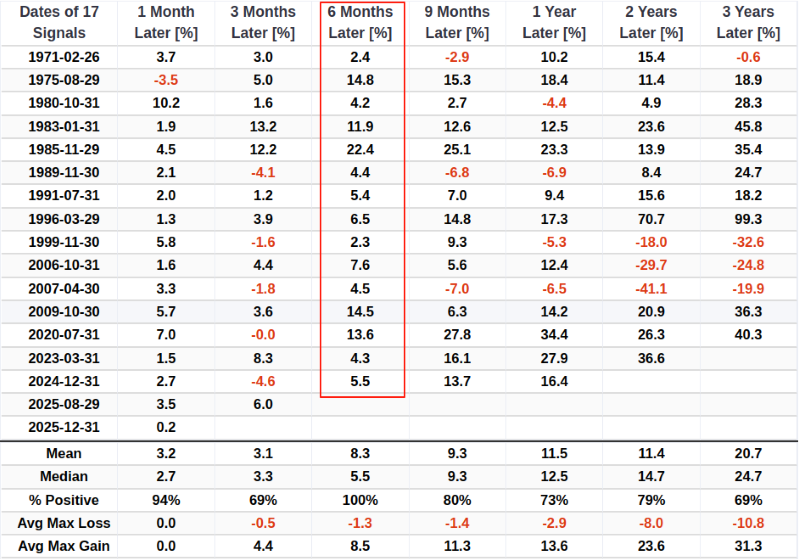
The chart and table below shows a summary of S&P 500 Index performance following all signals when:
- MIM Crosses Above 0.6
- AND the S&P 500 Index was ABOVE its 10-month moving average
Historically, results have been primarily positive. Notably, the signal has achieved a perfect win rate over the six-month timeframe.
A closer look at crude oil
The chart and table below display crude oil following those occasions when the MIM crossed from below 0.60 to above 0.60.
As shown below, crude oil performance has been underwhelming over the three-month period following these signals.
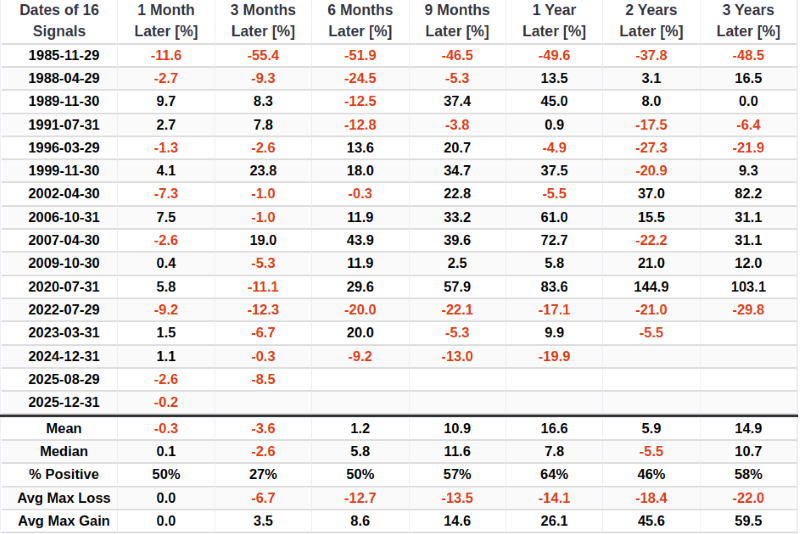
Given the current macroeconomic environment and geopolitical factors, volatility in oil prices may increase. The message here is perhaps not that traders should aggressively short crude oil right now, but rather that they should closely monitor opportunities to do so.
What the research tells us...
The Macro Index Model (MIM) has improved to a level that historically signals a low probability of near-term recession. This economic resilience, combined with the S&P 500 trading above its long-term trend, creates a favorable backdrop for equities, with historical data showing consistently strong returns over the next six months. However, this same environment has often coincided with weakness in crude oil prices.
The latest signal does not guarantee an economic boom or further stock market rally. It does, however, lend significant weight to the bullish case for both the economy and the stock market.