
The MACD indicator triggered a buy signal for the S&P 500

Key points:
- The MACD for the S&P 500 generated a buy signal within the context of an oversold market in an uptrend
- Similar trend-following momentum signals produced excellent results across all time horizons
- When an alert occurs as the S&P 500 is entering a bullish seasonal window, results are even better
Buy oversold conditions in an uptrend, rinse, and repeat
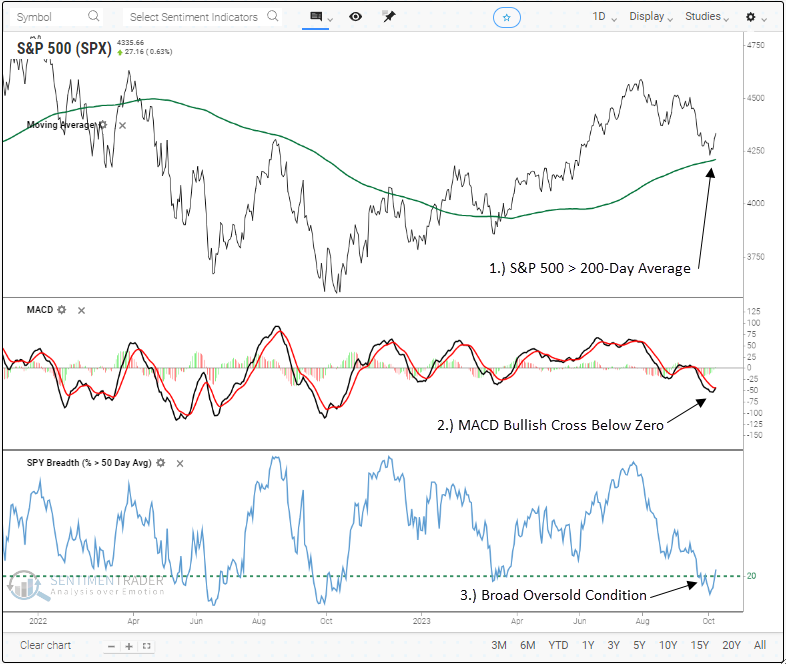
The Moving Average Convergence/Divergence (MACD), a popular trend-following momentum indicator created by Gerald Appel, triggered a buy signal for the S&P 500 on Monday when the MACD crossed above the MACD average with the indicator below zero. Please note I use the standard indicator settings found in most charting platforms.
Although MACD buy signals are frequently observed, it's crucial to consider the context. Before the latest alert, fewer than 20% of S&P 500 stocks closed above their 50-day average, indicating a broad oversold condition. This oversold setup coincided with the S&P 500 trading above its 200-day moving average.
The previous signal occurred in March 2023, leading to a 10% gain over the following six months.
Similar price momentum signals led to excellent results
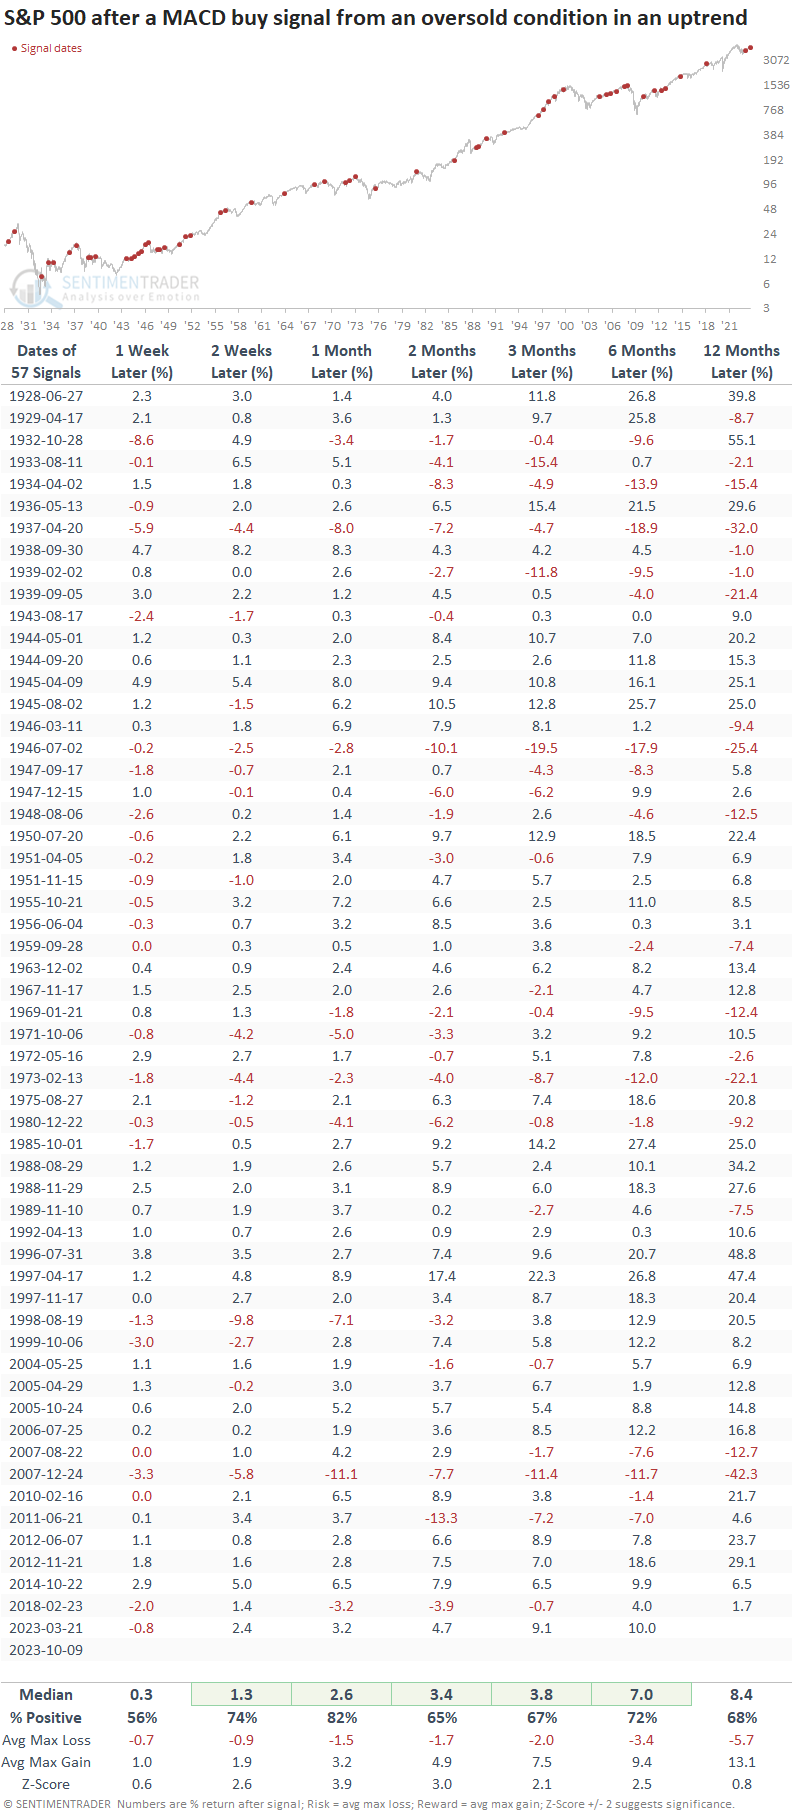
When a MACD buy signal occurs within the context of an oversold condition in an uptrend, the S&P 500 displayed excellent returns, win rates, and z-scores across all time horizons.
A month later, the world's most benchmarked index was higher 82% of the time, with a median gain that was significantly better than the median gain over the study period.
Seasonality trends for the S&P 500
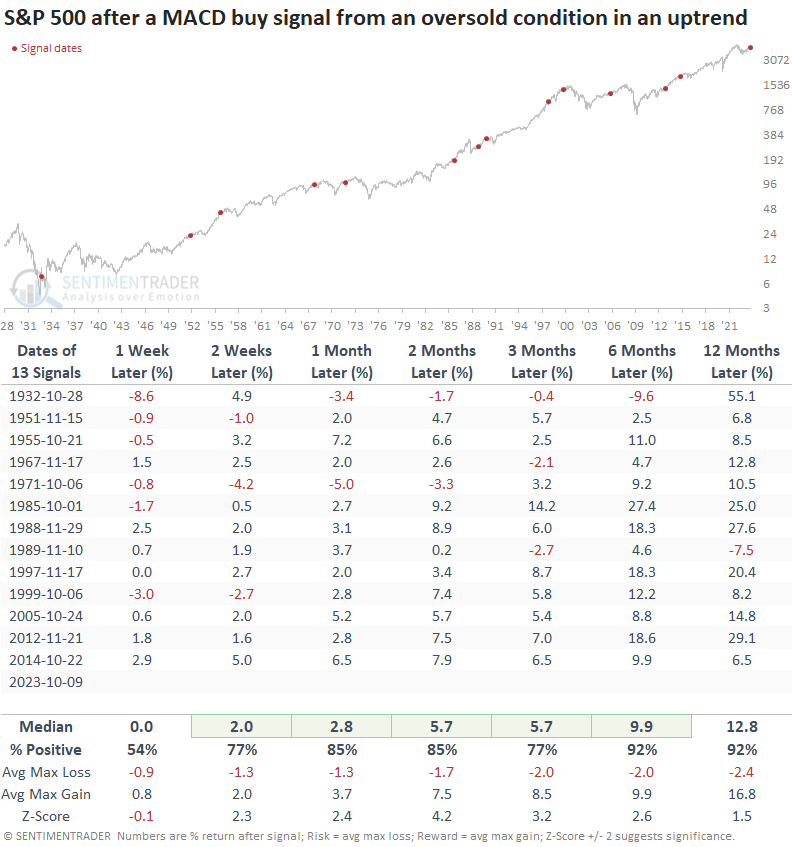
With seasonality about to turn positive, let's isolate signals that occurred in October and November.
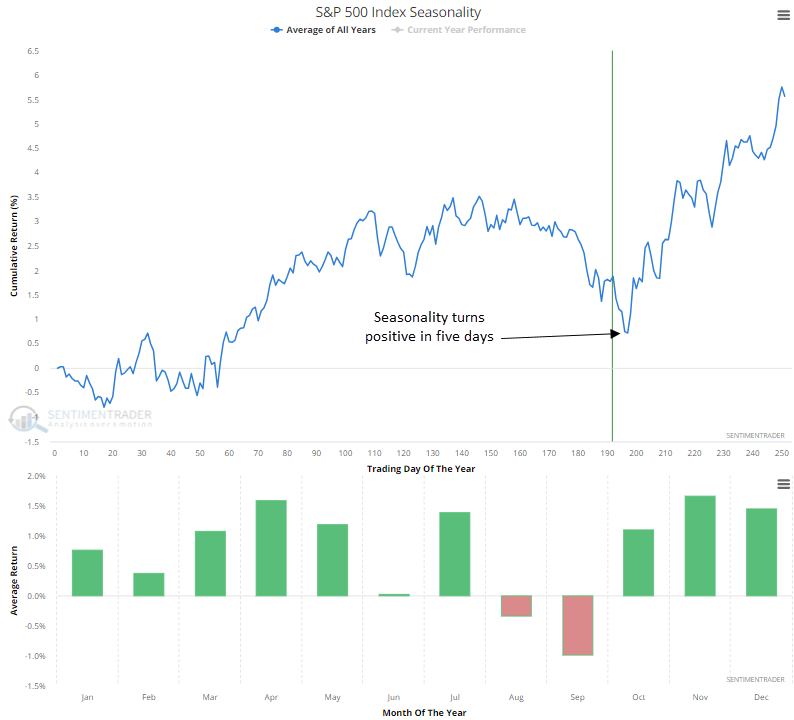
Whenever a MACD buy signal emerges in either October or November, S&P 500 performance is nothing short of phenomenal, consistently surpassing instances that occurred at any time. Over the subsequent six to twelve months, the S&P 500 recorded gains at some point every time.
What the research tells us...
Buying oversold conditions is a high-risk, high-reward endeavor. To avoid catching the proverbial falling knife, I like to use technical indicators to identify when the downside momentum has reversed to a bullish scenario. One such tool, the MACD, triggered a buy signal with the broad market oversold and in an uptrend. Similar alerts suggest the S&P 500 can rally over the ensuing months. That's especially true when a precedent occurs in October or November, the start of a robust seasonal window.