
The leveraged loan alternative for income investors

Key Points
- Leveraged loans are provided to borrowers that have high levels of debt and/or low credit ratings and may offer a higher risk, but higher-yielding alternative to traditional bonds for income investors
- The S&P/LSTA Leveraged Loan 100 Index is a daily tradable index for the U.S. market that seeks to mirror the market-weighted performance of the largest institutional leveraged loans.
- The Invesco Senior Loan ETF (BKLN) attempts to track the S&P/LSTA U.S. Leveraged Loan 100 Index
- A focus on seasonality and trend may improve upon simple buy-and-hold results
BKLN as a proxy for Leveraged Loan 100 Index
The Invesco Senior Loan ETF (Fund) is based on the S&P/LSTA U.S. Leveraged Loan 100 Index (Index). The Fund will typically invest at least 80% of its total assets in the component securities that comprise the Index. The Index is designed to track the market-weighted performance of the largest institutional leveraged loans based on market weightings, spreads, and interest payments.
The chart below (courtesy of Stockcharts.com) displays price action for BKLN. Note the tendency to trade steadily for long periods of time with significant drawdowns along the way.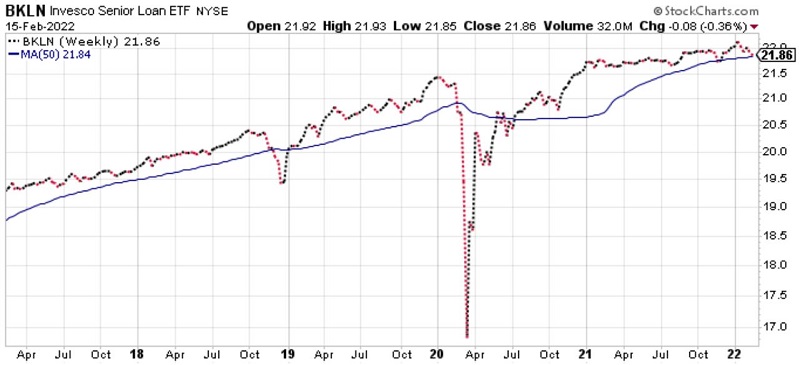
For testing purposes, we will use the following data series:
- From January 2002 through March 2011, we will use monthly total return data for the S&P/LSTA U.S. Leveraged Loan 100 Index
- From April 2011 through January 2022, we will use monthly total return for Invesco Senior Loan ETF (BKLN)
- NOTE: In the charts below, this data series is labeled as "BKLN." Note that the results represent a combination of index and ETF returns and are hypothetical, not actual trading results.
Seasonality
The chart below displays the growth of $1 invested in BKLN only during December and January.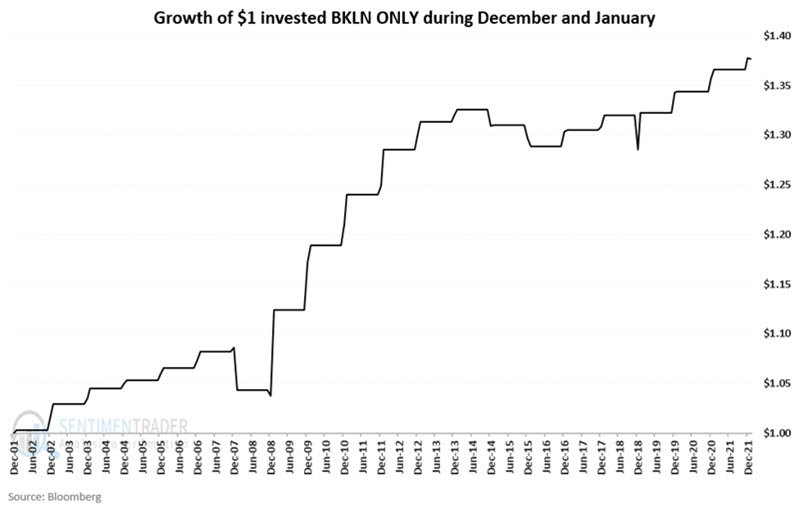
The chart below displays the growth of $1 invested in BKLN only during April through July.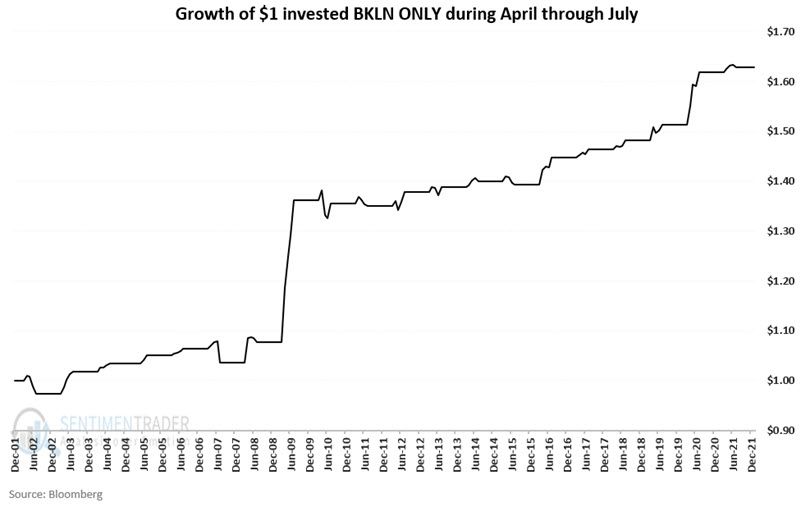
The chart below displays the growth of $1 invested in BKLN only during December and January plus April through July.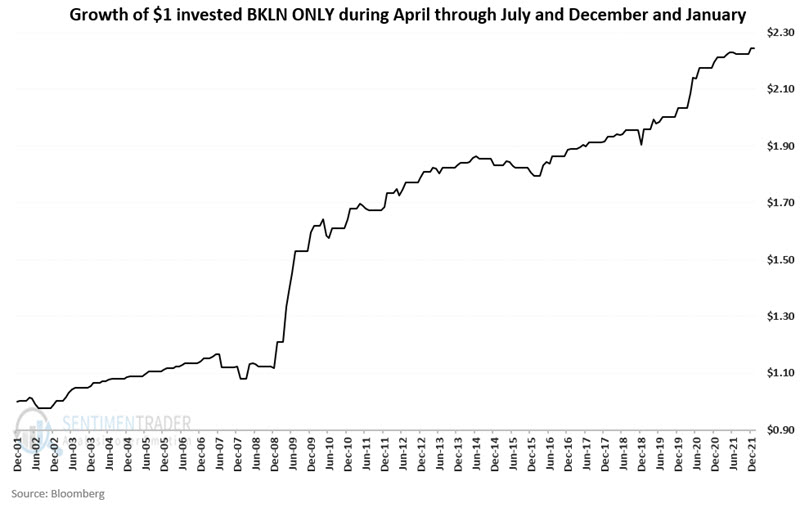
Conversely, the chart below displays the growth of $1 invested BKLN during all other months of the calendar year (i.e., Feb, Mar, Aug, Sep, Oct, and Nov).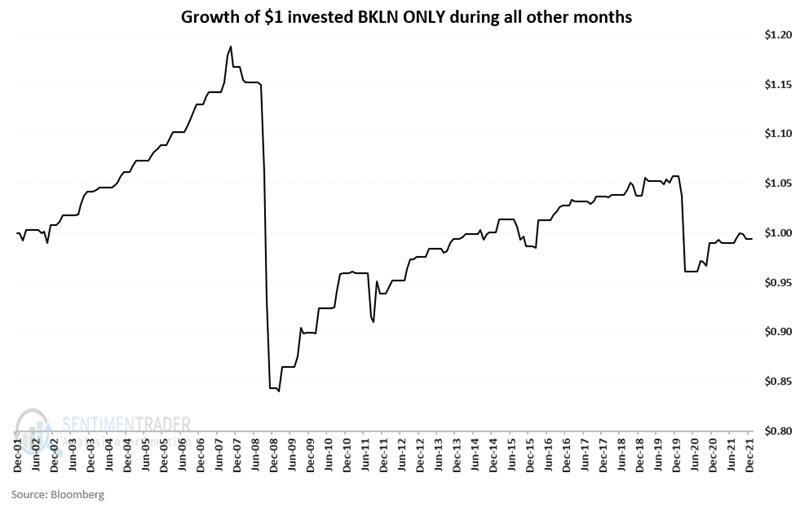
Trend-Following
Leveraged loan performance is tied to the ability of the borrowers to repay the loans. This performance is linked to the state of the overall economy. One of the best guides to overall economic strength or weakness is the stock market itself. So, let's use the S&P 500 Index as a trend-following proxy for leveraged loans.
The chart below displays the growth of $1 invested in BKLN only when the S&P 500 closed the previous month above its 10-month simple moving average.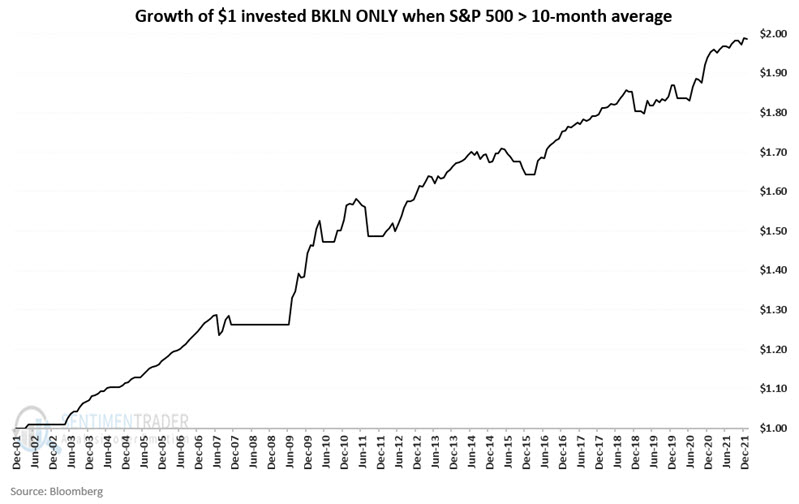
The chart below displays the growth of $1 invested in BKLN only when the S&P 500 closed the previous month below its 10-month simple moving average.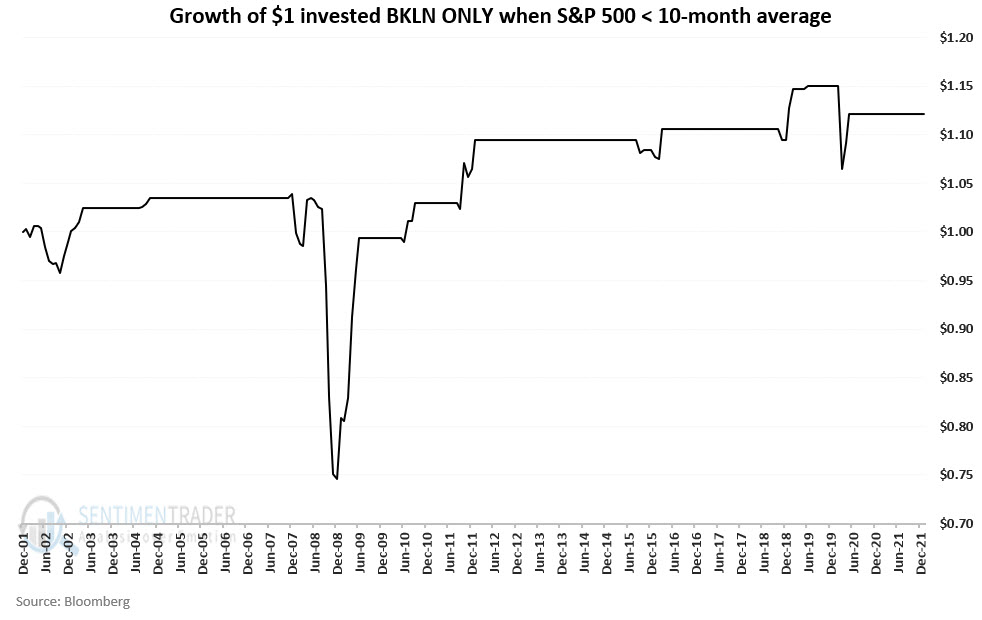
Combining Seasonality and Trend
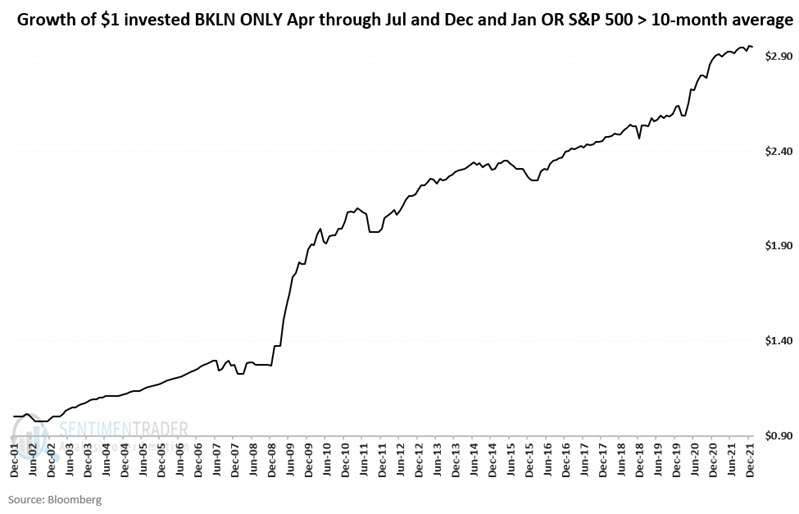
The chart below displays the growth of $1 invested in BKLN only when EITHER of the following is true:
- The current month is January, April, May, June, July, or December
- The S&P 500 closed the previous month above its 10-month simple moving average
The chart below displays the growth of $1 invested in BKLN only when NEITHER of the above is true.
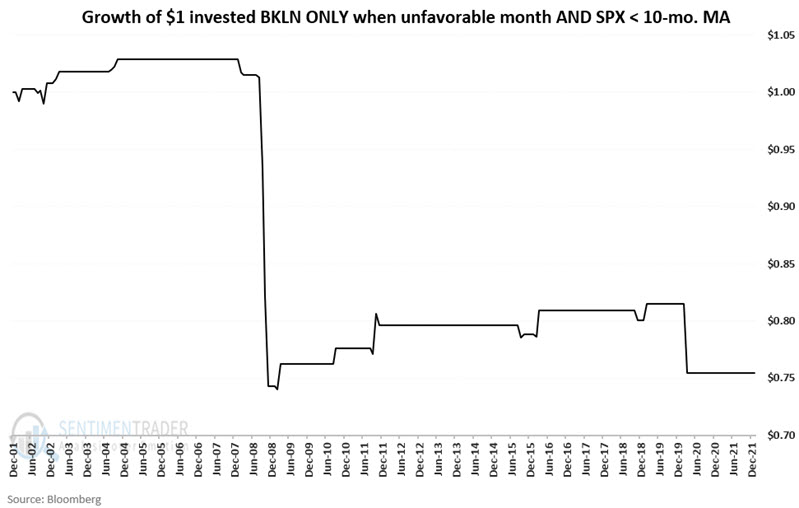
Results
One thing to note is that leveraged loans are not "high reward" in nature. They are essentially a higher yield/reward but higher risk alternative to more traditional government and high-grade corporate bonds.
The hypothetical results below:
- Include a mix of index and ETF returns as described earlier
- Include returns only for those months when the seasonal and trend strategy was in leveraged loans
- Include no gain or loss for those months when the seasonal and trend strategy was out of leveraged loans
Perspective and contrast
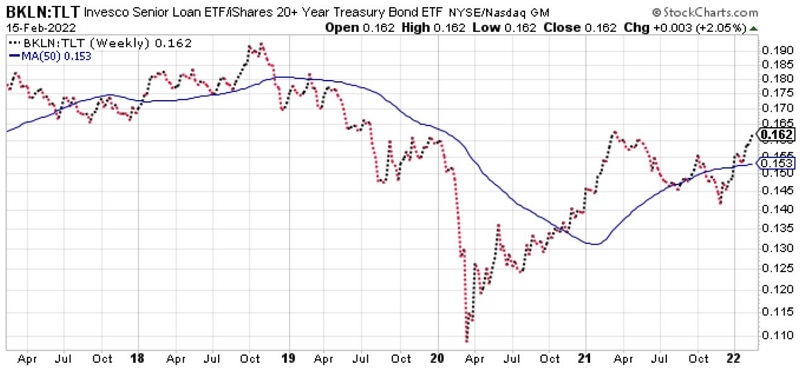
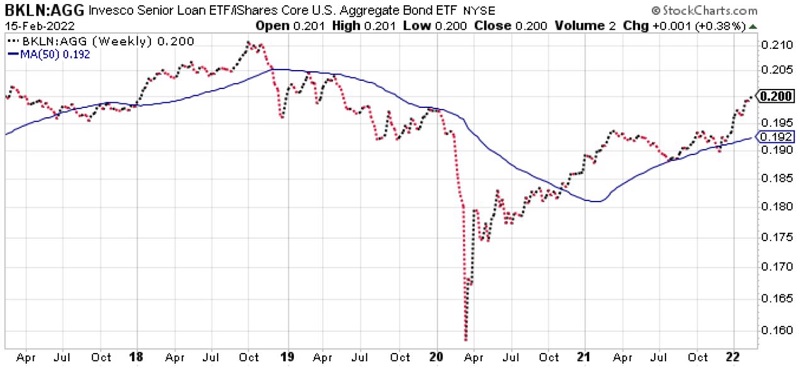
For the record, leveraged loans are not better or worse than traditional government or corporate, just different. Note that roughly 96% of BKLN non-cash holdings are floating rate in nature. This means that if interest rates continue to rise, the returns can actually improve versus traditional bonds, which will decline in price as rates rise. This has already been happening since interest rates bottomed in March 2020.
The chart below displays the performance for BKLN versus iShares 20+ Year Treasury Bond ETF (TLT).
The chart below displays the performance for BKLN versus iShares Core U.S. Aggregate Bond ETF (AGG).
The chart below displays the performance for BKLN versus iShares iBoxx $ High Yield Corporate ETF (HYG).
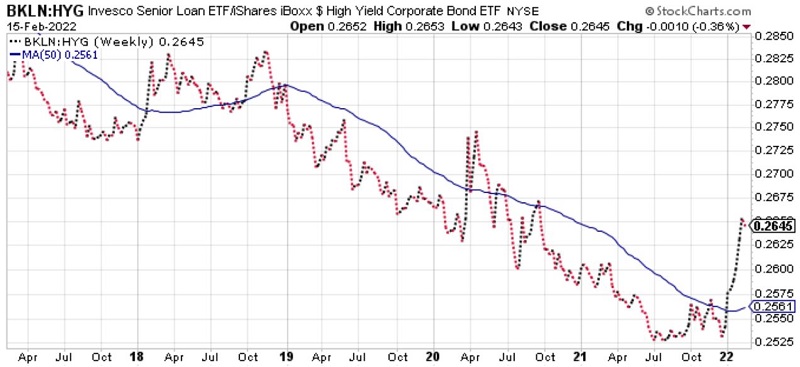
The first two charts above show that BKLN has outperformed long-term treasuries and the U.S. aggregate bond index since rates bottomed out in early 2020. In the last chart, we see that BKLN held up much better than a more traditional high-yield fund (HYG) during the January stock market selloff.
What the research tells us…
Leveraged loans offer income investors the potential to generate positive returns in a rising rate environment. They also entail unique risks. The seasonal and trend-following factors discussed earlier may help mitigate some of the risks of investing in leveraged loans.