
The January (and other) Effect on sectors

Key points:
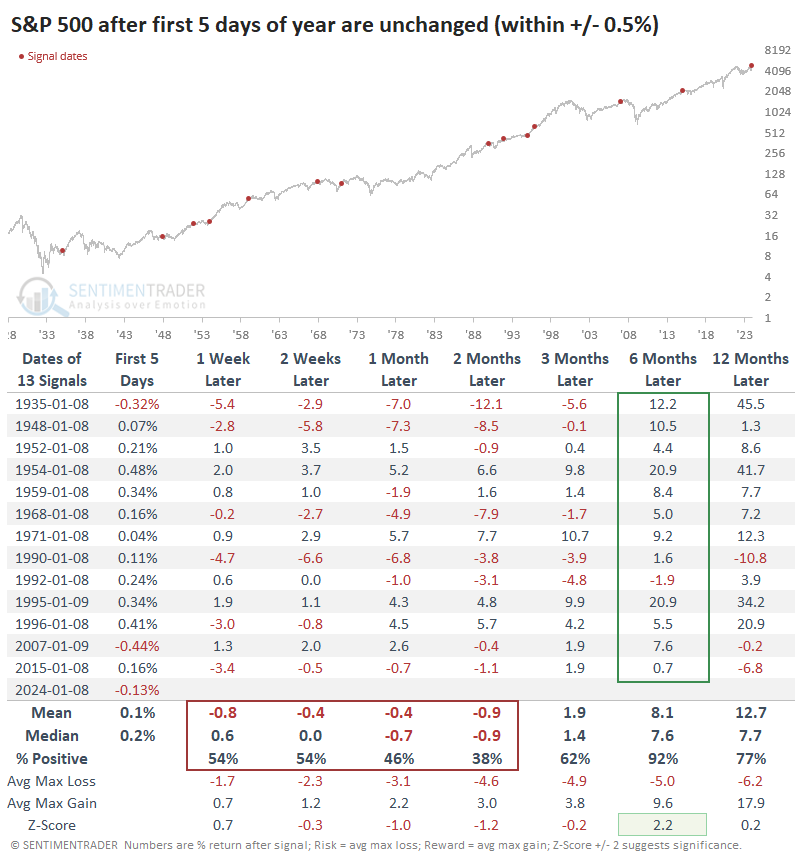
- The S&P 500 was basically unchanged during the first 5 days of the year, which hasn't been a great sign
- A more notable impact occurs if the rest of January shows a negative return
- April actually had the most significant impact on returns over the next 11 months, and high-beta sectors showed even greater differences
The January Effect and its impact on the next 11 months
A lot of ink has been spilled about January's first five trading days and how it implies a positive or negative year. The theory borders on the ridiculous, but for those who care, this year threw a wrench into the analysis; the first five days were essentially a wash.
The table below shows other years when the first week was basically unchanged. These are years when the S&P 500 closed the 5th trading day of the year within 0.5% of the prior December's close. After these unchanged first weeks, the S&P showed poor returns over the next couple of months. But for whatever reason, the next six months were abnormally positive, with only one minor loss that was quickly erased.
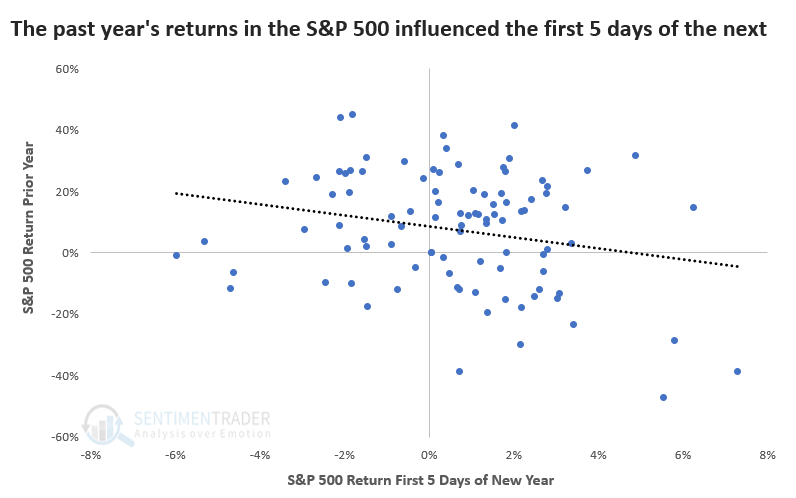
The first five days are heavily influenced by the prior year because, during good years, investors hold off on selling until the start of the New Year to delay paying capital gains taxes.
If the S&P 500 rallied more than 20% in a year, the first five days of the following year gained only 57% of the time. If the prior year was down -10% or more, the first five days were up 80% of the time.
A more popular seasonal influence is the January Effect. This phenomenon suggests that investors' preferences in January extend to the entire year.
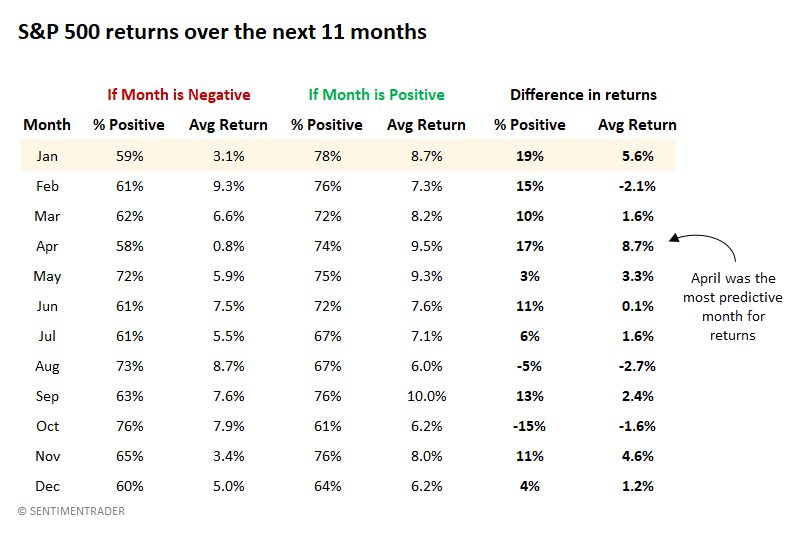
The main problem with this assertion is that it doesn't account for any month's predictive power over the following 11 months. The table below corrects this, and it suggests that maybe we should focus more on the "April Effect."
The table shows returns over the next 11 months, depending on whether the current month is positive or negative. For example, when the S&P 500 showed a positive return in January, the next 11 months were also positive 78% of the time. But when the S&P declined in January, the next 11 months were up only 59% of the time. That's a difference of 19%. And the average return differed by +5.6%.
That's the most significant difference in consistency among all months, but April took the crown for differences in return. When the S&P declined in April, the next 11 months returned only +0.8%, but when it rallied in April, the next 11 months averaged +9.5%.
Interestingly, October was a pretty good contrary indicator. The following 11 months were more likely to rally if October was negative than if it was positive.
January (and other months') impact on the next 11 months for sectors
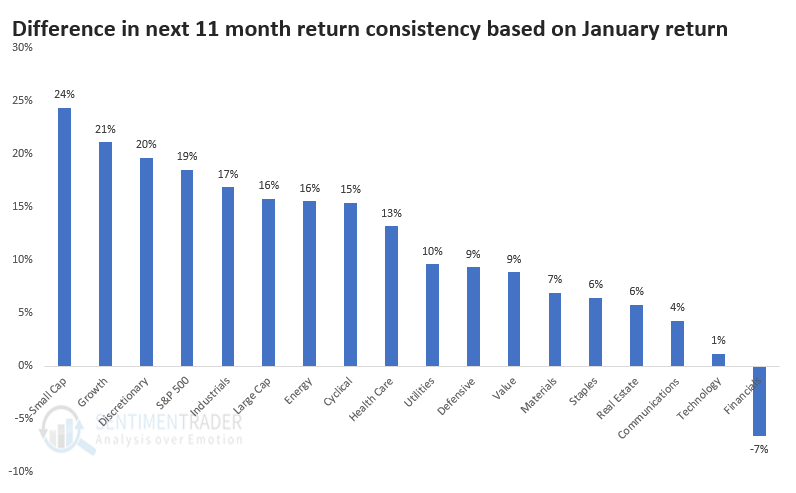
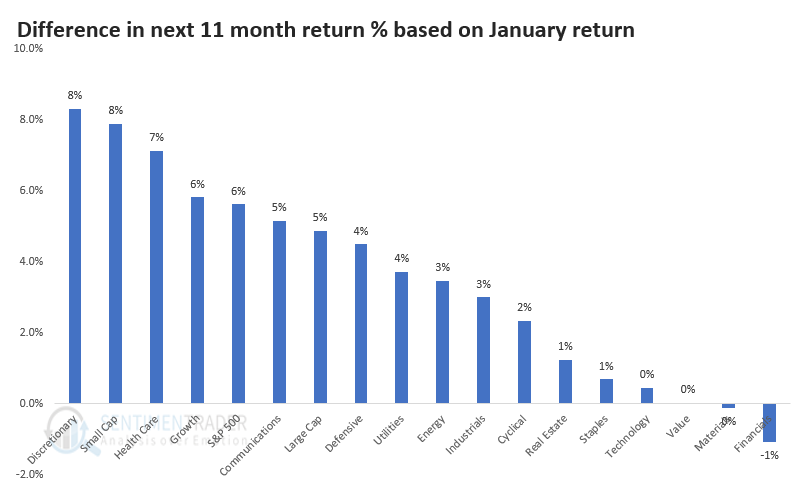
Let's persist with the January Effect and consider its efficacy for sectors and factors. The chart below shows the difference in consistency for the next 11 months depending on whether that sector or factor rallied or declined in January.
That might be confusing, so let's focus on Small Caps. If Small Caps rallied in January, they were 24% more likely to rally over the next 11 months than if they declined in January. Growth and Discretionary stocks also showed a vast difference in returns, which suggests that higher-beta stocks had a more pronounced January Effect.
The chart below shows the same analysis but uses average returns instead of consistency. Discretionary stocks tended to return 8% more over the next 11 months if they rallied in January than if they declined. Small Caps and Growth also showed significant differences, as did Health Care, which was a bit of a surprise.
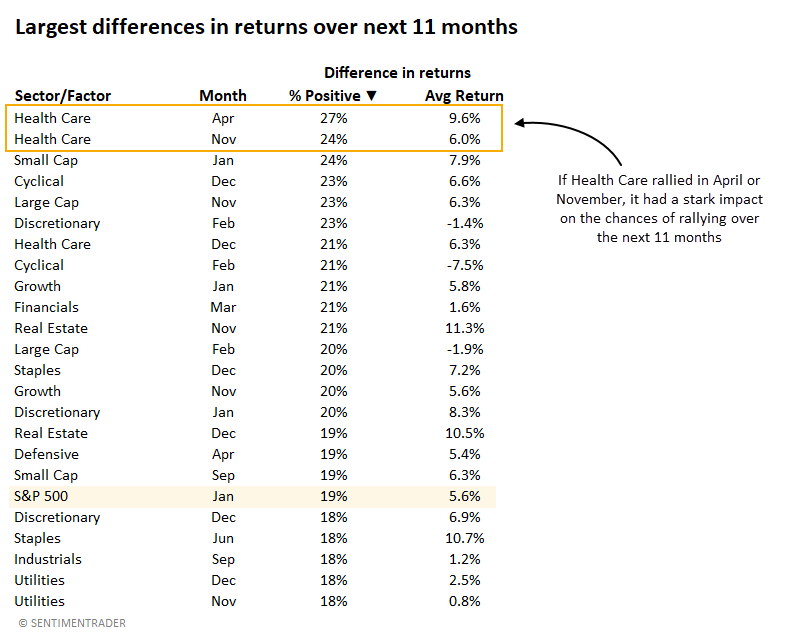
The table below looks at all sectors and factors (as well as the S&P 500) and all months' predictive power over the next 11 months. It sorts each sector and month by the greatest difference in consistency. Health Care comes out on top, with April and November having the greatest impact on returns over the next 11 months.
This shows that if Health Care stocks rallied in April, they were 27% more likely to rally over the next 11 months than if they declined in April.
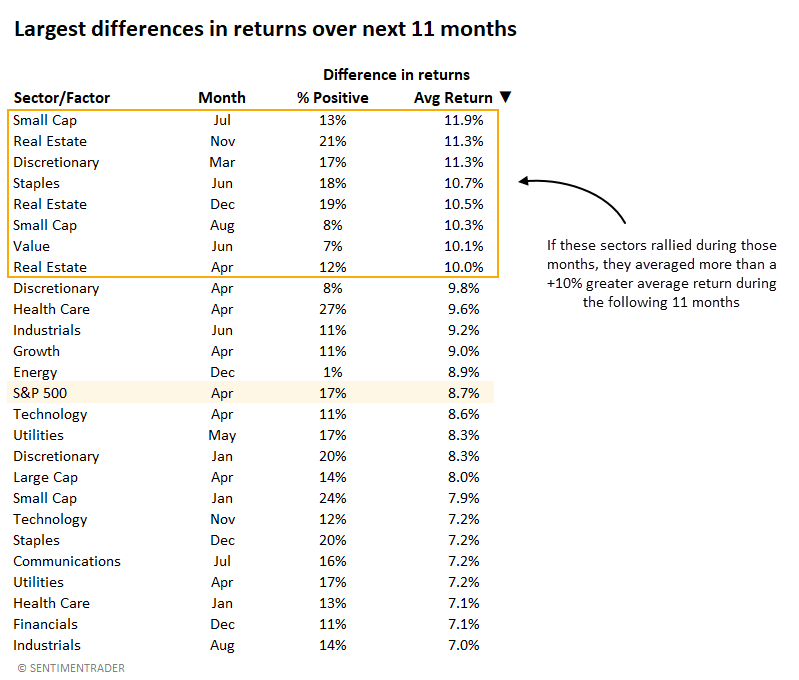
The table below shows the same information, but it's sorted by average return instead of consistency. Small Cap performance in July had the greatest impact on returns over the next 11 months.
What the research tells us...
There are all kinds of seasonal effects that get a lot of air time on financial media because they're moderately interesting, and people like a good, simple story. For the most part, the January Effect is real, but it's not as iron-clad as we might like. April has actually had a more significant impact on S&P 500 returns over the next 11 months.
Stocks dropped modestly during the first week of the year, which isn't a great sign for the short term, but it's also entirely consistent with historical behavior after a good year for returns like 2023 was due to tax incentives. Across sectors and factors, January has had the biggest impact on higher-beta stocks like Small Caps and Discretionary. However, certain months for specific sectors have had an even more outsized impact on the next 11 months. That might just be a statistical anomaly, or there might be something to do with how businesses in those sectors operate.