
The ISM Prices Paid Index plunges into contraction territory

Key points:
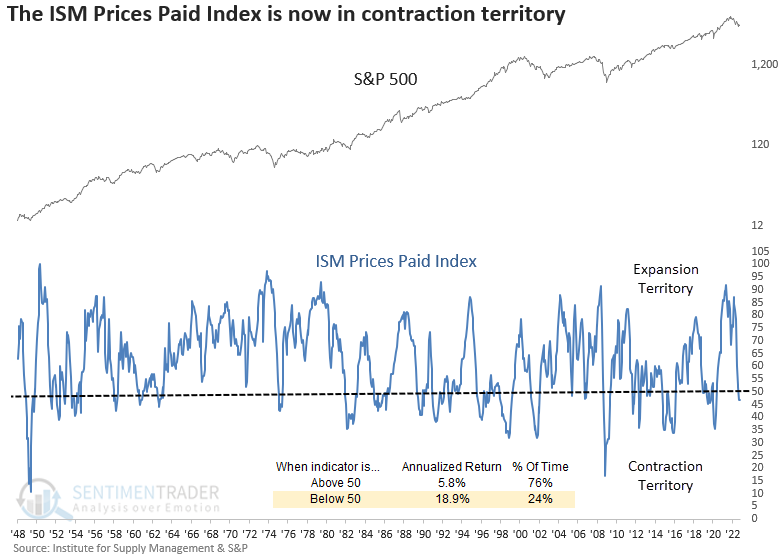
- The ISM Prices Paid Index fell below 50% (contraction territory) and closed at a 12-month low
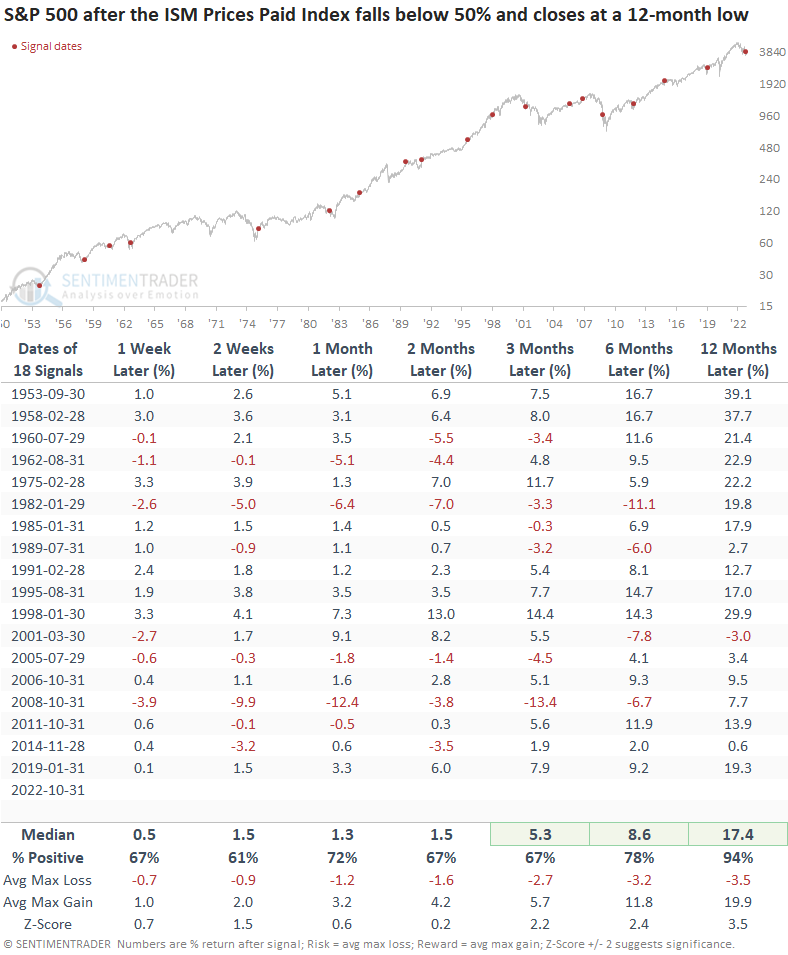
- After similar contractions, the S&P 500 was higher 94% of the time a year later
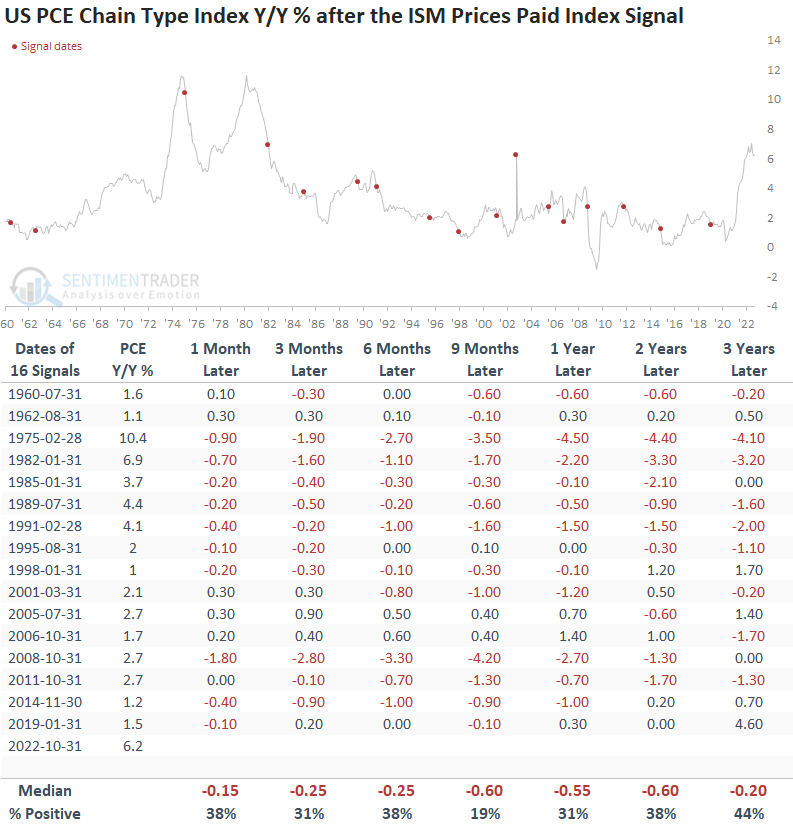
- The Federal Reserve's preferred measure of inflation should move lower over the next 12 months
A contraction in the ISM Prices Paid Index bodes well for stocks on a long-term basis
In a previous note, I shared a study that suggested stocks could struggle as the ISM New Orders and Employment Indexes continued to hover in contraction territory.
The Institute for Supply Management released the latest manufacturing data this week, and the Prices Paid Index plunged into contraction territory. At the same time, the index closed at a 12-month low.
With the Federal Reserve tightening monetary policy to tame inflation, easing price pressures would be a welcome development for consumers and stocks.
Stocks like lower inflation
When the Prices Paid Index falls below 50%, and the index registers a 12-month low, the S&P 500 was higher 94% of the time a year later. While long-term performance is excellent, the signal can be untimely on a medium-term basis during extended bear market periods. Significant drawdowns occurred in 1982, 2001, and 2008.
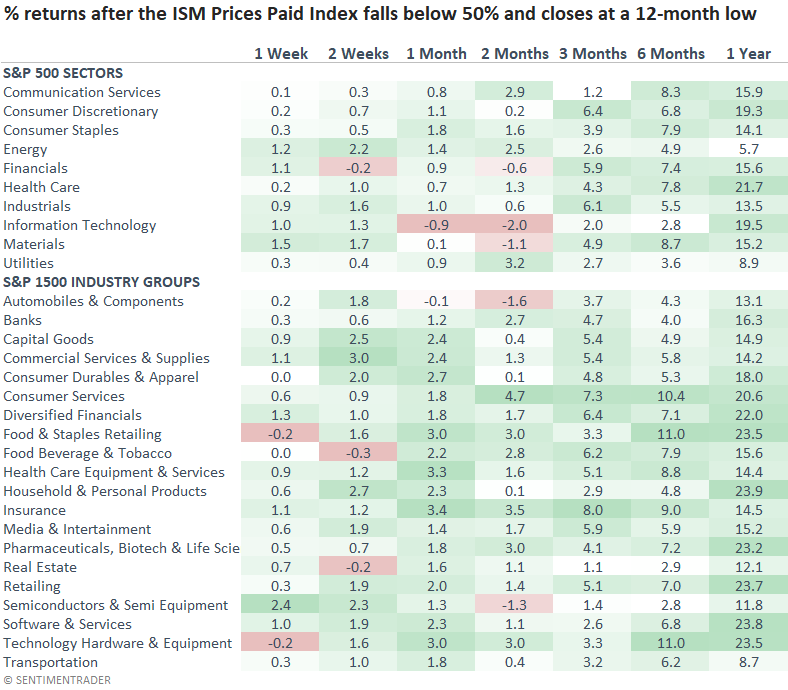
Sector results suggest one should continue to favor energy over technology for the next few months.
Consumers could get some relief in the prices paid for goods and services
A plunge in the ISM Prices Paid Index bodes well for a potential easing in the inflation outlook from the Federal Reserve's preferred inflation measure.
What the research tells us...
While most traditional measures of inflation remain elevated and near 40-year highs, the ISM Prices Paid Index has plunged into contraction territory. The easing in inflationary pressures is typically a bullish development for stocks, especially long-term. If history repeats, we should see some relief from other measures of inflation that impact consumers.