
The interest rate/commodity relationship that hides in plain sight - Part II

Key points
- In Part I, we revealed an interesting relationship between (very short-term) interest rate trends and the trend of commodities as an asset class
- In Part II, we will look at using commodity ETFs to utilize what was covered in Part I
A quick review of interest rates versus commodities
For testing purposes, we used two indexes.
- Starting in 1960, we used the Bloomberg Commodity Spot Price Index (ticker BCOMSP), representing a basket of commodities and a useful proxy for commodities as an asset class. Before 1960, we used monthly changes in the Bloomberg Commodity Index (ticker BCOM), which tracks the prices of a basket of commodity futures contracts
- To track interest rates, we looked at the month-end value for ticker TNX, which tracks the 10-year treasury note yield
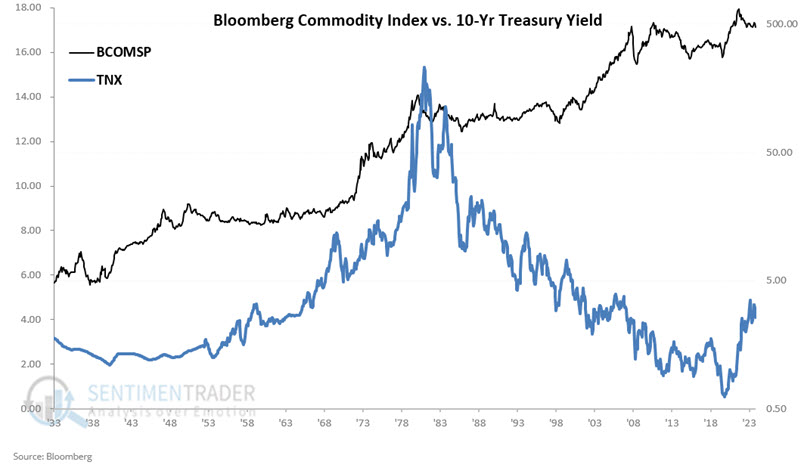
Starting in 1933, we looked at the end of each month to see if TNX was above or below its 1.3-month exponential moving average. If above, the next months were deemed "favorable" for commodities, and vice versa. Currently, the indicator is "unfavorable," as TNX closed below its 1.3-month EMA at the end of June and again at the end of July.
The chart below displays the hypothetical growth of $1 invested in the Bloomberg Commodity Spot Index only during "favorable" months on a logarithmic scale.
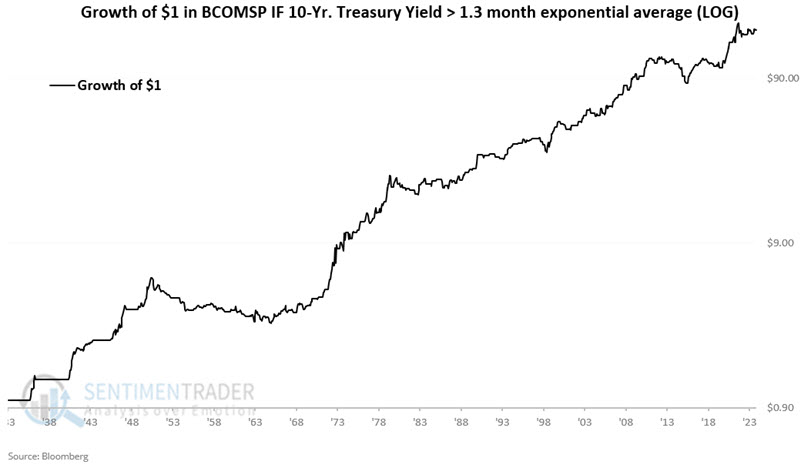
The hypothetical gain for September 1933 through July 2024 is +17,450%.
The chart below displays the hypothetical growth of $1 invested in the Bloomberg Commodity Spot Index only during "unfavorable" months on a logarithmic scale.
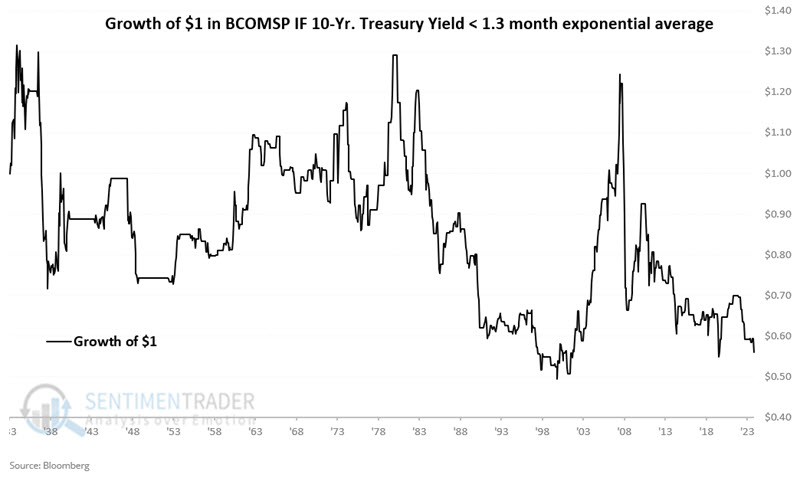
The hypothetical loss from holding BCOMSP only during unfavorable periods for the TNX indicator from September 1933 through July 2024 is -44%.
Now, let's look at applying this method to real-world trading.
Commodity ETFs offer exposure to a basket of commodities
There are now many commodity-related ETFs that track a basket of commodities. Two that purport to track the Bloomberg Commodity Index are iPath Bloomberg Commodity Index Total Return ETN (ticker DJP) and the abrdn Bloomberg All Commodity Strategy K-1 Free ETF (ticker BCI). However, these funds are both relatively thinly traded (an average of 89,000 and 230,000 shares traded per day)
Two more heavily traded options include the Invesco Optimum Yield Diversified Commodity Strategy No K-1 ETF (ticker PDBC) and the Invesco DB Commodity Index Tracking Fund (ticker DBC). The average daily volume for the four funds listed and their respective expense ratios appear in the table below.
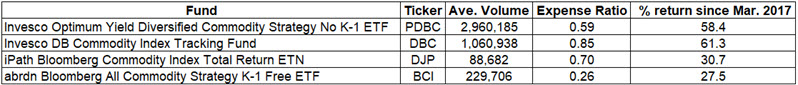
For trading purposes, ticker PDBC has a lower expense ratio and higher trading volume and does not issue a K-1 for tax purposes. However, for testing purposes, we will use ticker DBC, which has the longest history, starting in March 2006.
Testing the TNX indicator using a commodity ETF
It is not necessarily recommended that the method detailed in Part I be used as a standalone investment strategy. However, we are going to do so here for illustrative purposes. Starting in March 2006:
- If TNX - 1.3-month EMA > 0 at the end of this month, we hold ticker DBC for the entirety of the following month
- If TNX - 1.3-month EMA <=0, then we will be flat with no position
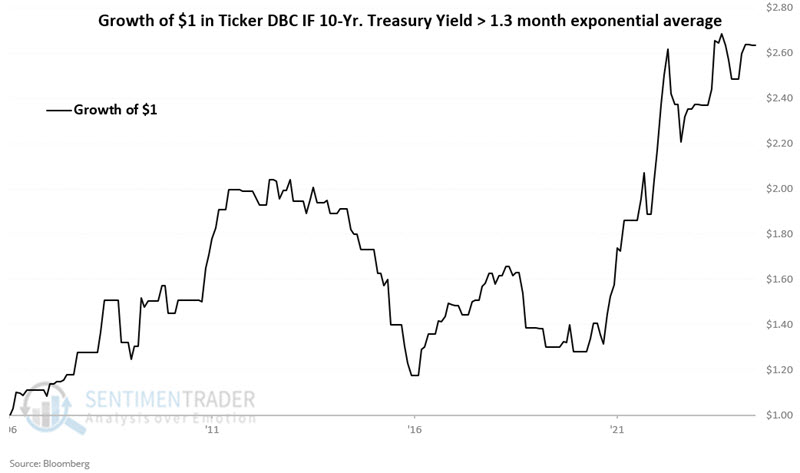
The chart below displays the hypothetical growth of $1 invested in DBC only during favorable months. The good news is that the cumulative % gain is +163.5%. The bad news is that there was a significant drawdown along the way. Still, suppose we are looking for an "edge" in commodities (rather than relying solely on this indicator as a standalone trading model). These results look quite useful compared to DBC performance when the TNX indicator is unfavorable.
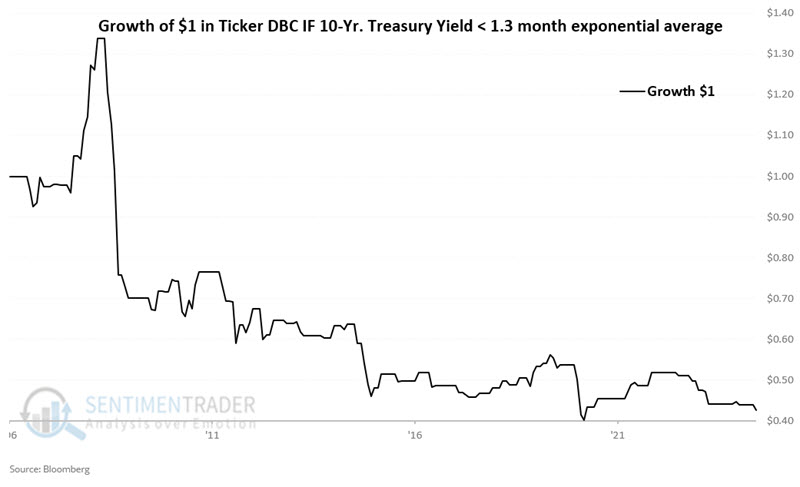
The chart below displays the hypothetical growth of $1 invested in DBC only during unfavorable months. The cumulative % loss is (-57.4%).
The chart below displays both data series above on one chart for comparative purposes.
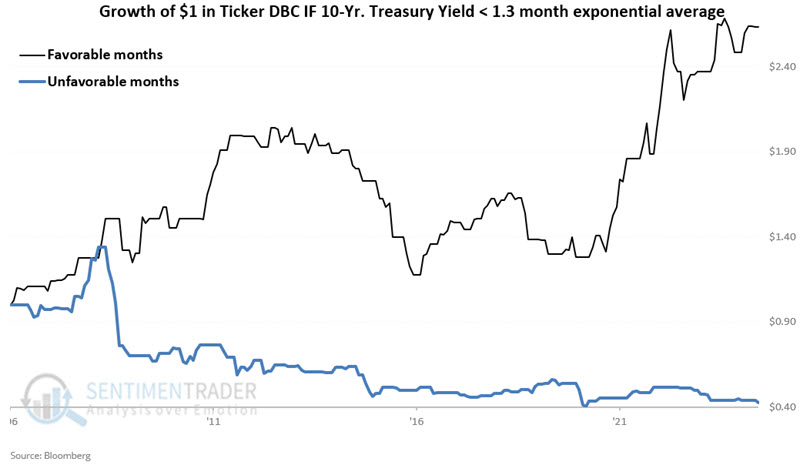
The bottom line: Holding a commodity ETF when the TNX indicator is favorable does not guarantee profits nor eliminate the risk of significant drawdowns. That said, the probability of commodity prices rising is much higher if the TNX indicator is favorable versus unfavorable.
What the research tells us…
Price movements in individual physical commodities are primarily a function of current supply and demand. However, certain seasonal factors can influence individual commodities, and extreme trends in inflation can also have an outsized effect on the overall trend of commodities as an asset class. Changes in interest rates appear to be a secondary influence and, thus, should likely not be used as a standalone method for trading commodities. That said, the probability of commodity prices rising is much higher if the TNX indicator is favorable versus unfavorable.