
The index soars, but the troops don't follow

Key points:
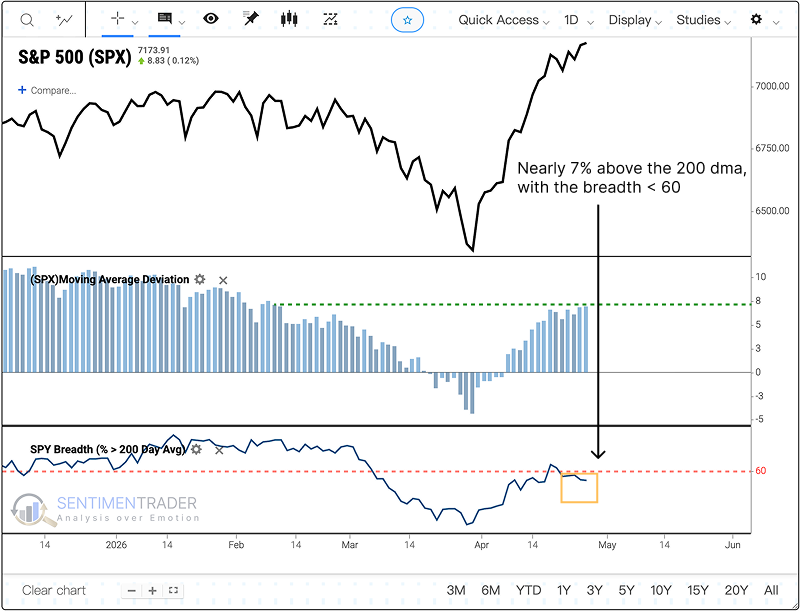
- The S&P 500 sits nearly 7% above its 200-day average, yet less than 60% of SPY components trade above their own 200-day line
- This divergence has triggered only 20 times since 1998 - adding a 126-day cooldown reduces it to 9 independent signals
- The Fear & Greed Index just completed a full round trip from below 10 to above 80, a cycle that has happened 25 times in the index's history
- Short-term returns after the F&G cycle favor caution, but longer windows show the index was higher 78% of the time a year later
Price leads, breadth lags
The S&P 500 closed at 7,173 on April 27, stretching more than 6% above its 200-day moving average. By itself, that's not unusual during a bull run - indices are supposed to lead their components.
But underneath the surface, participation has thinned. Fewer than 60% of SPY constituents hold above their own 200-day averages. The index is running ahead of its own internals.
When the S&P trades this far above its trend while breadth trails, it has triggered a signal only 20 times since 1998. The cluster is telling - 1998 and 1999 account for nine of those, and five fired during the post-C