Products
SentimenTrader Trading Tools
‍
Backtest Engine
My Trading Toolkit
Correlation Analysis
Seasonality
Market Prediction
Indicators & Data API
‍
Proprietary Indicators & Charts
Market Data API
Strategies & Scanner
‍
50+ Trading Strategies
Smart Stock Scanner
Smart Option Scanner
Research Reports
‍
Research Solutions
Reports Library
Free Resources
Simple Backtest Calculator
Simple Seasonality Calculator
The Kelly Criterion Calculator
Sentiment Geo Map
Public Research Reports
Education
Sentiment Indicators
Technical Indicators
Pricing
Company
About
In the News
Testimonials
Client Success Stories
Contact
Log inLoginSign up
< BACK TO ALL REPORTS

The homebuilders suggest the bear market is over

Dean Christians
2023-01-31
Homebuilders transitioned from a downtrend to an uptrend, triggering a buy signal for the group and the broad market. After similar conditions, the builders and the S&P 500 were higher in all but one case a year later.

Key points:

  • A medium-term moving average for Homebuilders increased for > 20 consecutive days
  • At the same time, a long-term moving average for Homebuilders increased for > 15 straight days
  • After similar price trend conditions, Homebuilders and the S&P 500 enjoyed excellent returns

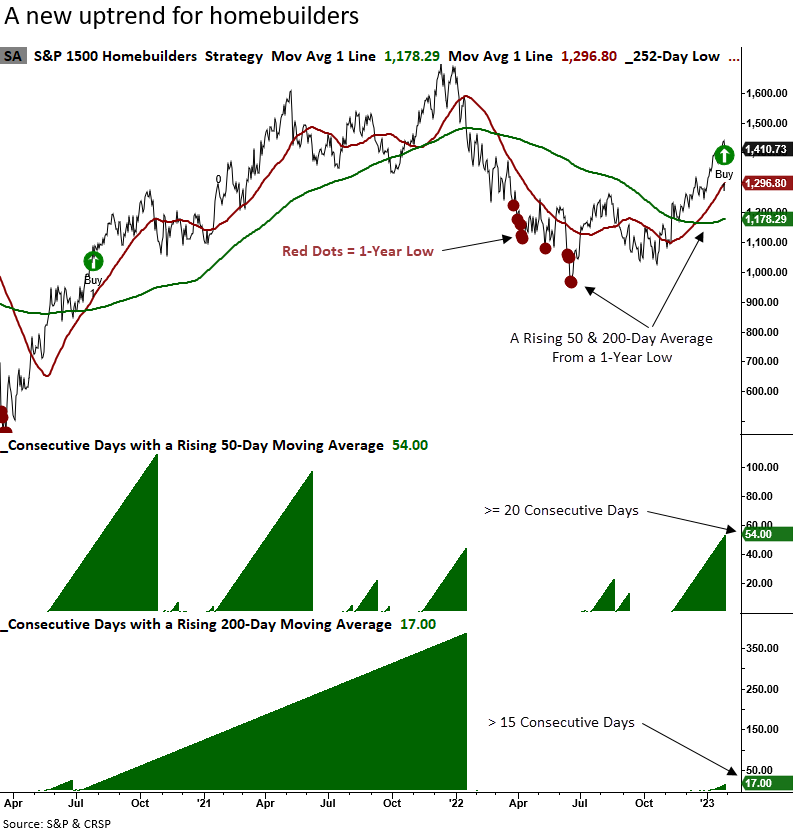
The Homebuilding industry cycled from a 1-year low to an established uptrend

For only the 14th time in over 50 years, the homebuilding sub-industry group cycled from a 1-year low to an established medium and long-term uptrend. 

An uptrend condition occurs when the 50-day moving average rises for >= 20 consecutive days and the 200-day moving average rises for > 15 straight days.

The emergence of a new uptrend for a highly cyclical and capital-intensive industry bodes well for the homebuilders and the broad market.

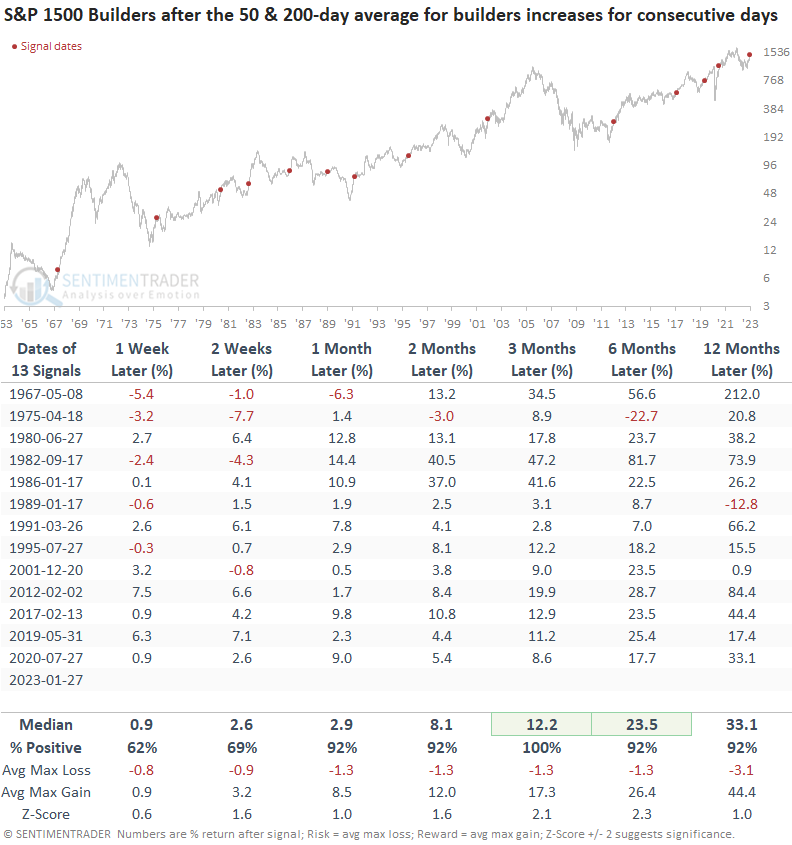
Similar price trend reversals preceded excellent results

When Homebuilders' 50 and 200-day moving averages rise consistently after a 1-year low, returns, win rates, and z-scores for the industry are excellent across all time frames. Three months later, the group was higher 100% of the time, with a max loss of -10.6%, which occurred in 1967.

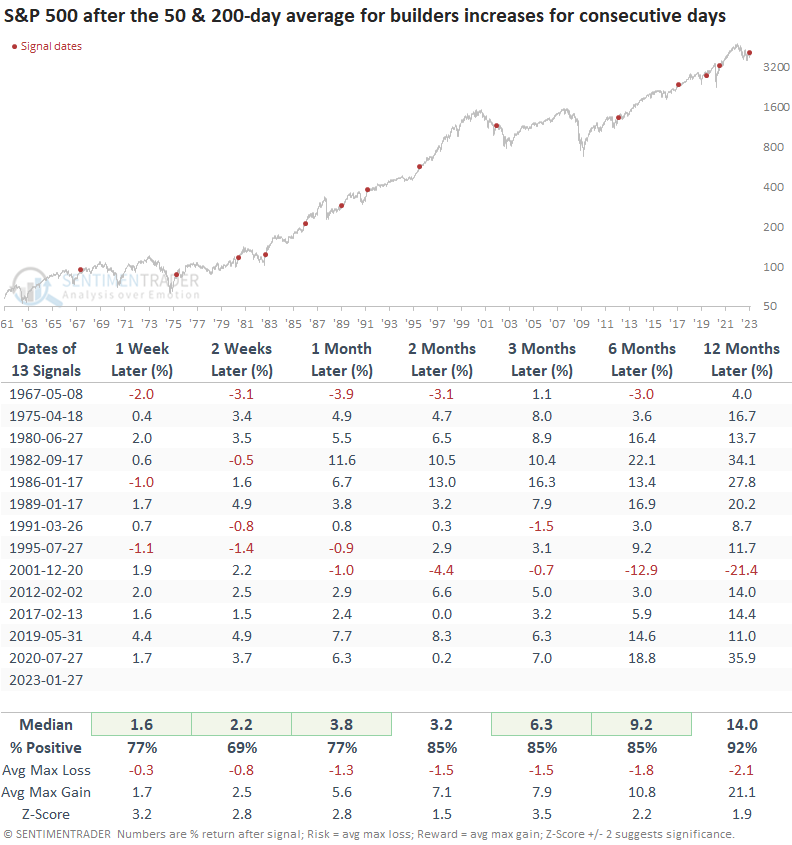
What's bullish for the homebuilders is bullish for the broad market. A year later, the S&P 500 was higher in all but one case, which occurred in the 2000-02 Dotcom bust. For what it's worth, if you utilize > 20 days instead of >= 20 days for the 50-day average condition, the 2001 signal goes away.

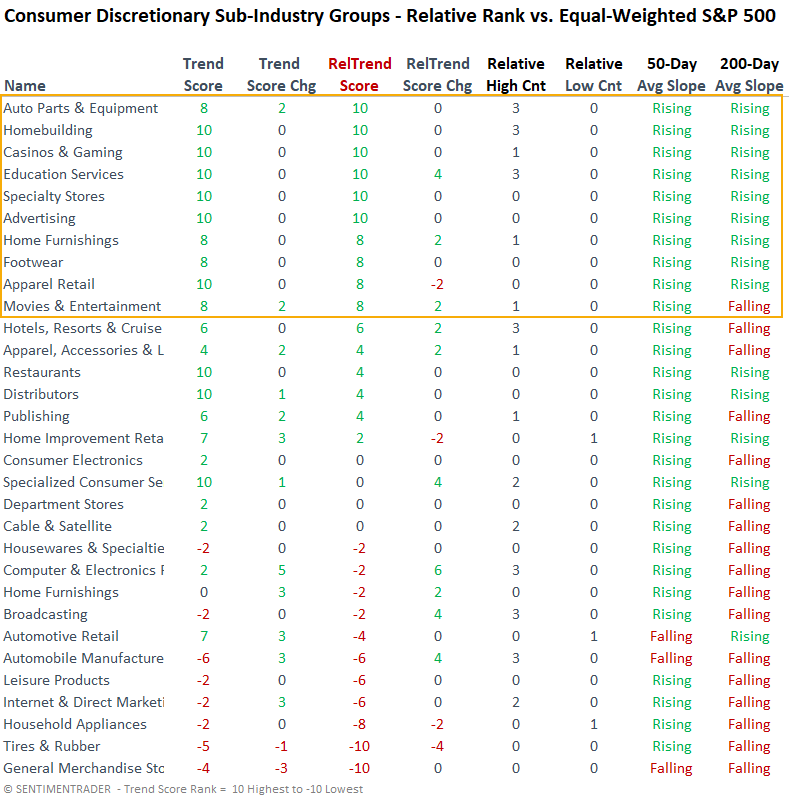
When I apply the signals to sectors, the Consumer Discretionary group outperformed all others a year later. And, as I've highlighted in recent research notes, one would be better off with an allocation to the equal-weighted Discretionary sector ETF versus a cap-weighted one.  

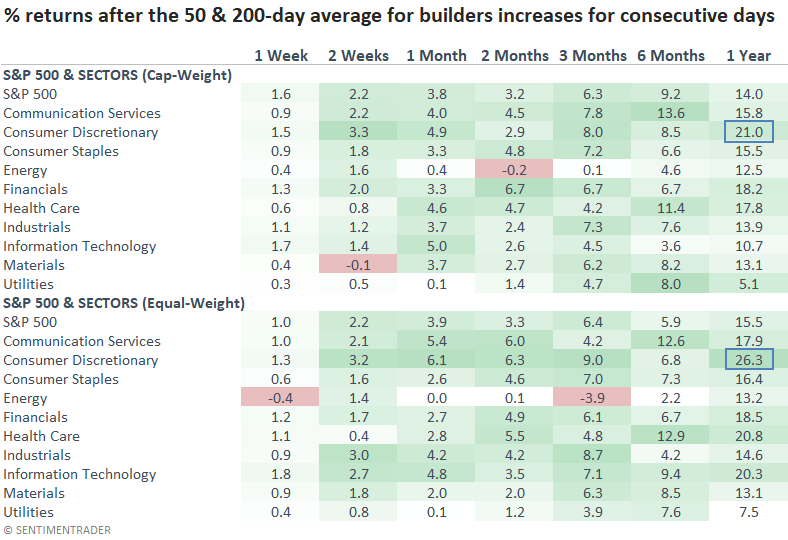
The number of Consumer Discretionary sub-industry groups with bullish absolute and relative trend scores continues to expand after one of the most significant bear market recoveries in more than 60 years.

What the research tells us...

The transition from a 1-year low to an established medium and long-term uptrend for the highly cyclical homebuilding industry adds one more piece of bullish evidence to the bull-bear debate. After similar price trend conditions, the homebuilders and the broad market enjoyed excellent returns with minimal drawdowns. While the macroeconomic environment remains a concern, it's hard to argue with the ticker tape.

PRODUCTS
SentimenTrader
Trading Tools
Indicators & Data API
‍
Strategies & Scanner
‍
Research Reports
FREE
RESOUrCES
Simple Backtest
Calculator
Simple Seasonality
Calculator
The Kelly Criterion
Calculator
Sentiment Geo Map
‍
Public Research Reports
‍
Education
Sentiment Indicators
‍
Technical Indicators
‍
Pricing
Bundle pricing
‍
FAQ
‍
Announcements
‍
COMPANY
‍
About
‍
In the News
‍
Testimonials
‍
Client Success Stories
CONTACT
‍
General Inquiries
‍
Media Inquiries
‍
Financial Professionals Inquiries
‍
© 2026 Sundial Capital Research Inc. All rights reserved.
Setsail Marketing
TermsPrivacyAffiliate Program
Risk Disclosure: The information and tools provided are for research and analytical purposes only and are not intended as investment advice. Market analysis involves uncertainty, and outcomes may differ from expectations. Users should conduct their own due diligence and consider their individual circumstances before making any financial decisions. Past performance is not necessarily indicative of future results.

Hypothetical Performance Disclosure: Hypothetical performance results have many inherent limitations, some of which are described below. No representation is being made that any account will or is likely to achieve profits or losses similar to those shown; in fact, there are frequently sharp differences between hypothetical performance results and the actual results subsequently achieved by any particular trading program. One of the limitations of hypothetical performance results is that they are generally prepared with the benefit of hindsight. In addition, hypothetical trading does not involve financial risk, and no hypothetical trading record can completely account for the impact of financial risk of actual trading. for example, the ability to withstand losses or to adhere to a particular trading program in spite of trading losses are material points which can also adversely affect actual trading results. There are numerous other factors related to the markets in general or to the implementation of any specific trading program which cannot be fully accounted for in the preparation of hypothetical performance results and all which can adversely affect trading results.

Testimonial Disclosure: Testimonials appearing on this website may not be representative of other clients or customers and is not a guarantee of future performance or success.