
The homebuilder paradox

Key points
- The housing market in the U.S. has been struggling for several years
- Despite this fact, homebuilding stocks have gained roughly 147% over the past 28 months
- A simple two-factor model suggests the potential for even more gains ahead
Homebuilder stocks soar while the housing market struggles
One of the most perplexing anomalies in recent years is the relationship between the housing market and homebuilder stocks. According to the National Association of Homebuilders, the housing market has been struggling for most of the last two years.
From the National Association of Homebuilders website:
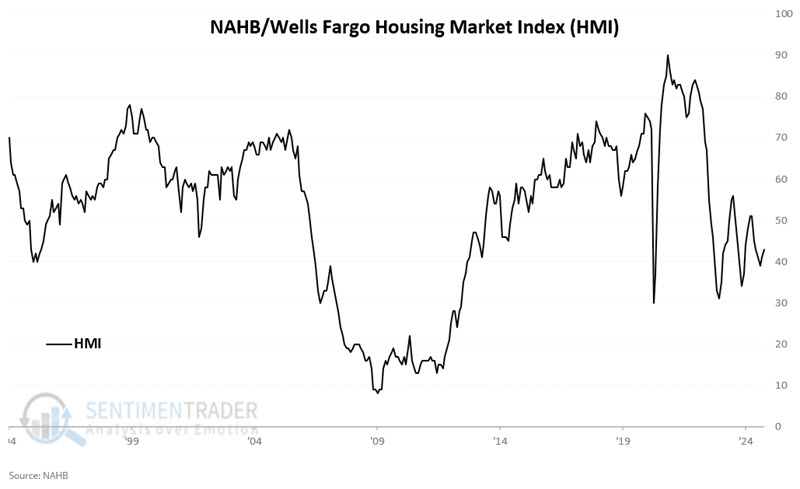
The NAHB/Wells Fargo Housing Market Index (HMI) is designed to gauge and track the pulse of the single-family housing market. The HMI is based on a monthly survey of single-family builders who are asked to rate three specific conditions of the housing market:
- Present sales of new single-family homes
- Expected sales of single-family homes for the next six months
- The traffic of prospective buyers of new single-family homes
Each month, the HMI depicts overall builder sentiment toward housing market conditions on a scale ranging between 0 and 100. A higher reading (>50) is an indication that the majority of builders feel confident about the current and near-term outlook for housing. Lower readings signify less optimism among builders.
The chart below displays the HMI over the last 30 years. For most of the last few years, this index has been under 50, i.e., unfavorable for the housing market.
But here's where it gets weird. The chart below displays the price action for the iShares U.S. Home Construction ETF (ticker ITB).
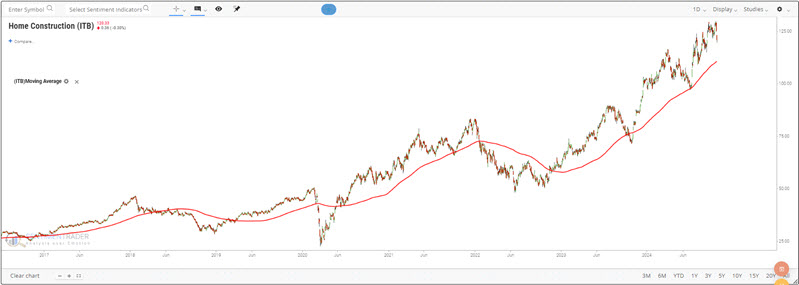
Since bottoming in mid-2022 - and despite a sharp sell-off in recent days - ITB has advanced roughly +147% in the past 28 months. Go figure.
Of course, the real question is, "Where to from here?" While we don't have a crystal ball, a simple two-factor model suggests continuing to give this sector the benefit of the doubt.
A two-factor approach to homebuilders
What follows is not intended to be used as a standalone trading model but instead as weight of the evidence regarding the homebuilding sector.
We will consider two indicators, giving each equal weight. Our test will start on 1972-05-31. We will use the S&P 1500 Homebuilders Index (SPHB1500) to measure performance.
The two indicators are:
- 10-year treasury yield vs. 6-month EMA
- Three specific months of the year
10-year treasury yield vs. 6-month EMA
At the end of each month, we compare the closing level of the 10-year treasury yield (ticker $TNX) to its own 6-month exponential moving average.
A = Month-end 10-year treasury yield
B = 6-month EMA
C = A - B
- A negative reading suggests declining interest rates, which is considered favorable for homebuilders for the following month.
- A positive reading suggests rising interest rates and is considered neutral for home builders for the following month.
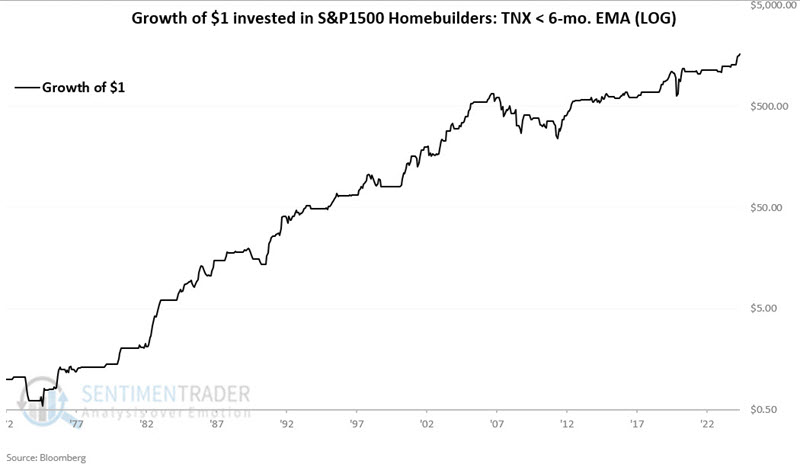
The chart below displays the hypothetical growth of $1 invested in SPHB1500 only when the indicator is favorable. Since 1972, $1 has grown to $1,661, albeit not without some significant drawdowns along the way.
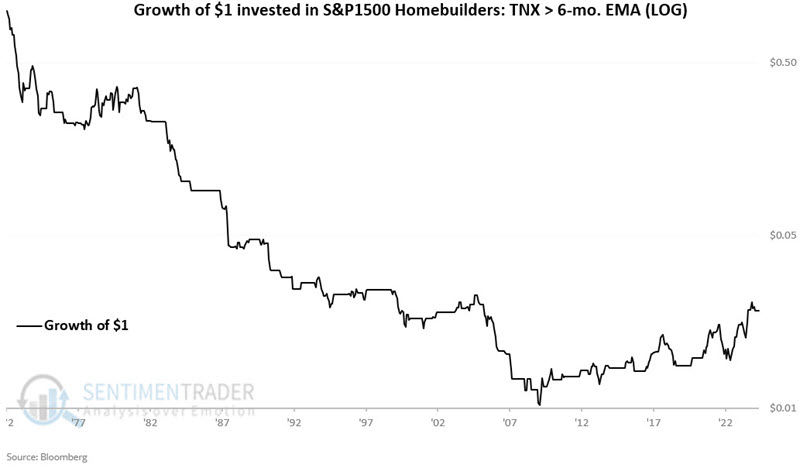
The chart below displays the hypothetical growth of $1 invested in SPHB1500 only when the indicator is neutral. Since 1972, $1 has declined to $0.02 (although it is worth noting that this is up 94% since September 2022, and even higher off the low established in 2008).
Two things to note:
Results have been much more favorable when rates are declining. However, as we can see in the charts above, there are times when homebuilders have fallen sharply when this indicator is favorable and others when they have rallied sharply when the indicator is unfavorable.
Three specific months of the year
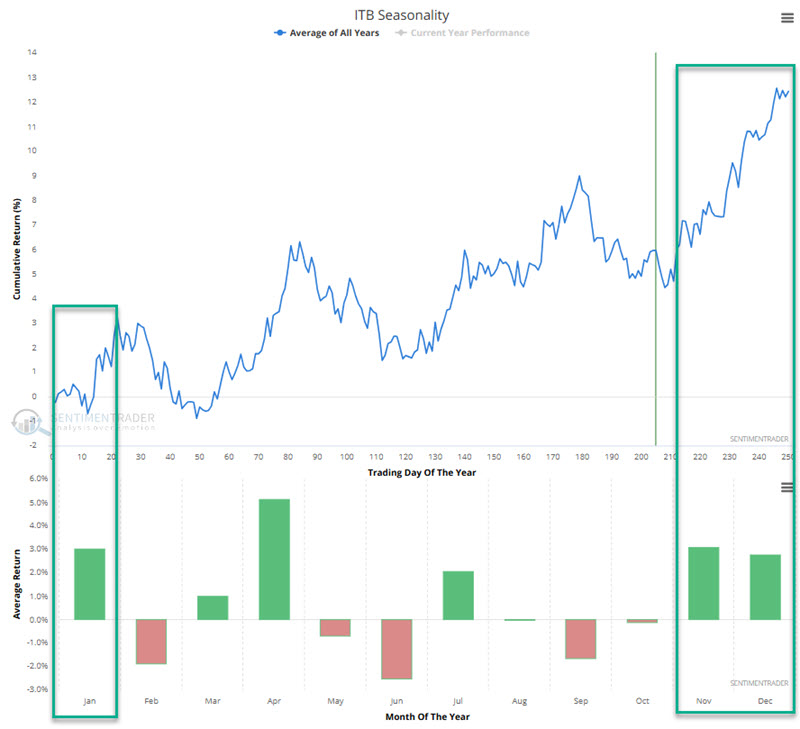
Homebuilders have a long history of demonstrating price strength during November, December, and January, so we will incorporate this as another indicator.
- +1 if the current month is November, December, or January, otherwise J = 0
This phenomenon is reflected in the annual seasonal trend chart for the iShares US Home Construction TF (ticker ITB) below.
The chart below displays the hypothetical growth of $1 invested in SPHB1500 only during November, December, and January. Since 1972 $1 grew to $117.58.
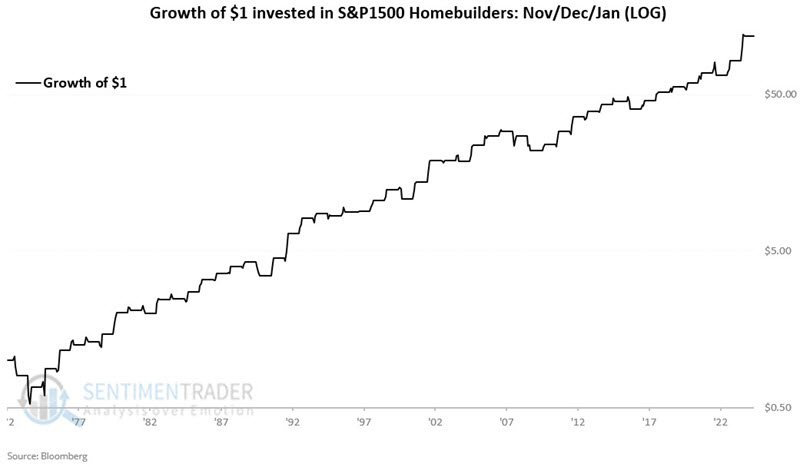
While the chart above trends from lower left to upper right, it should be noted that the 1969-1970 period lost 37.3%, the 1972-1973 period lost 20.2%, and the 2008-2009 period lost 20.0%. Likewise, one in four years (15 out of the last 61 years) saw homebuilders lose ground during November through January. so there is never any guarantee of an advance between November 1st and January 31st.
The chart below displays the hypothetical growth of $1 invested in SPHB1500 only when the indicator is neutral (i.e., all months, NOT November, December, or January). Since 1972, $1 has declined to $0.26.
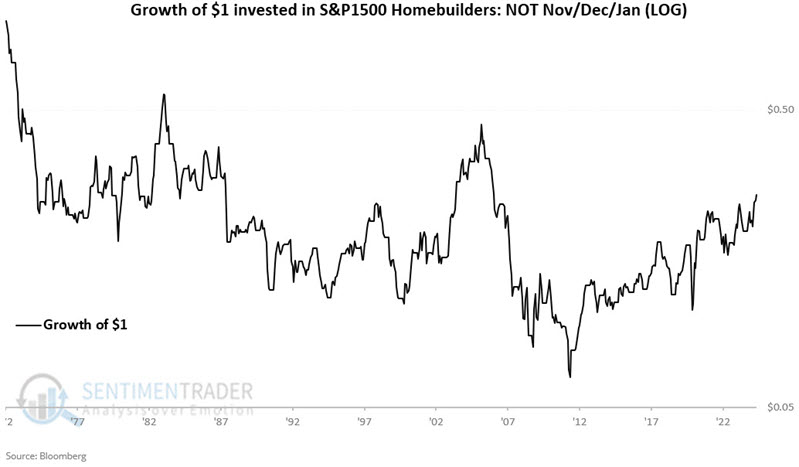
The same caveats apply here as per the indicator detailed above.
Putting the indicators together
Next, let's add the two indicators together. On any given day, the model can read 0, 1, or 2. We will refer to this total as HBSum.
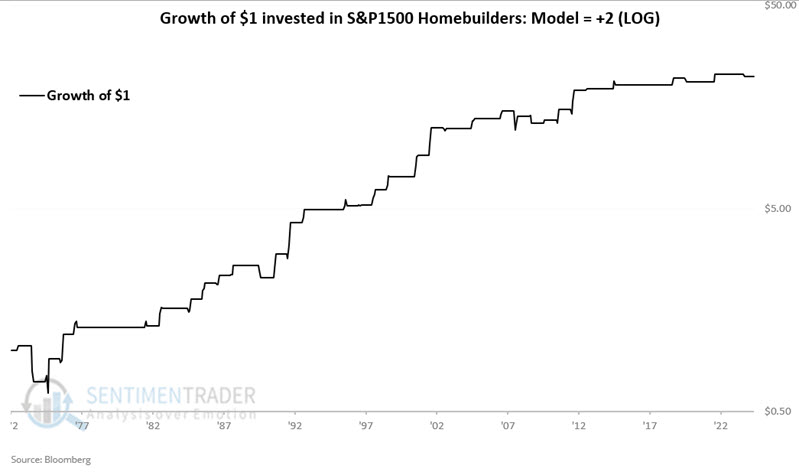
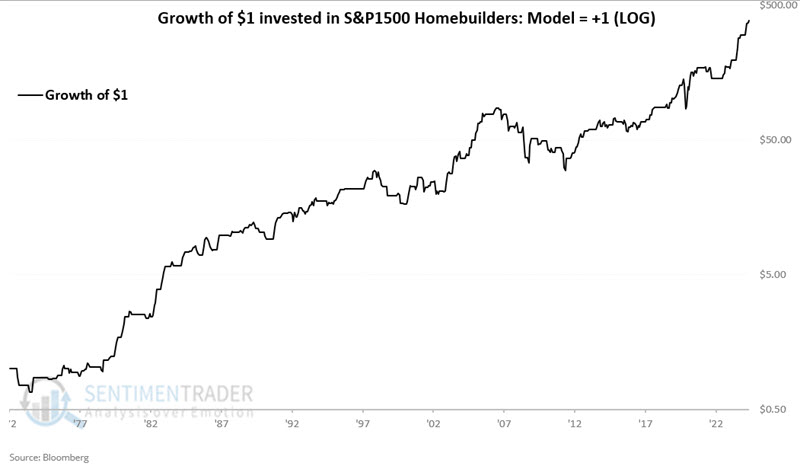
The chart below displays the hypothetical growth of $1 invested in SPHB1500 only when HBSum = 2 (i.e., both indicators are favorable). Since 1972, $1 has grown to $22.40.
The chart below displays the hypothetical growth of $1 invested in SPHB1500 only when HBSum = 1 (i.e., one or the other indicator is favorable). Since 1972, $1 has grown to $389.04.
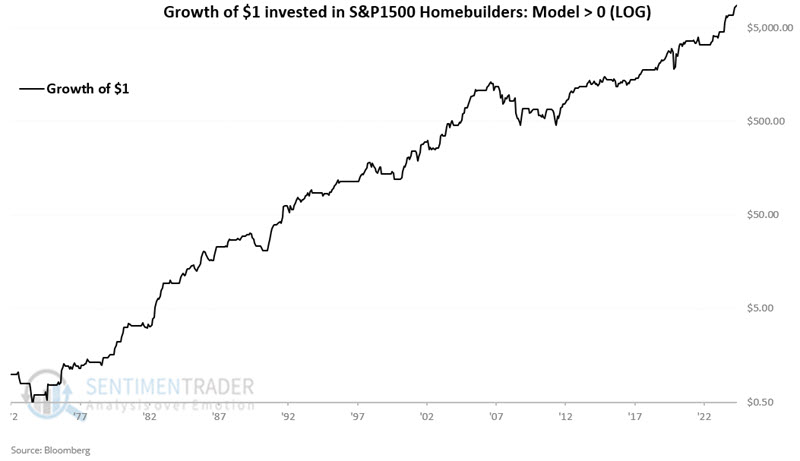
The chart below displays the hypothetical growth of $1 invested in SPHB1500 only when HBSum is > 0 (i.e., one or both of the indicators are favorable). Since 1972, $1 has grown to $ 8,716.38.
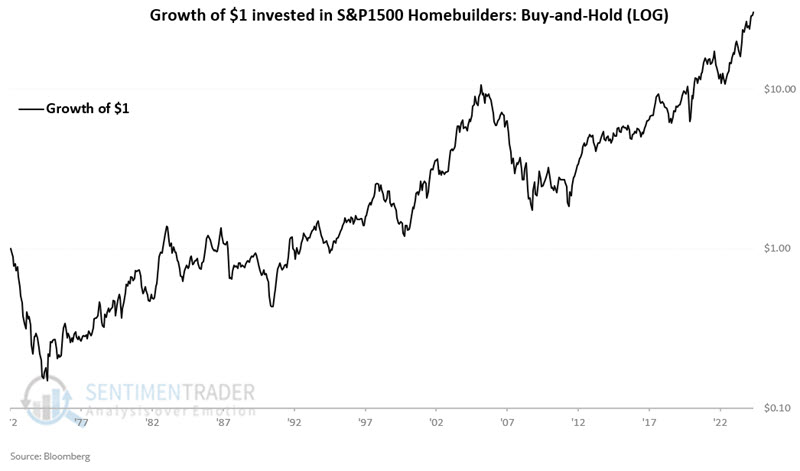
The chart below displays the hypothetical growth of $1 invested in SPHB1500 using a buy-and-hold approach. Since 1972, $1 has grown to $30.44.
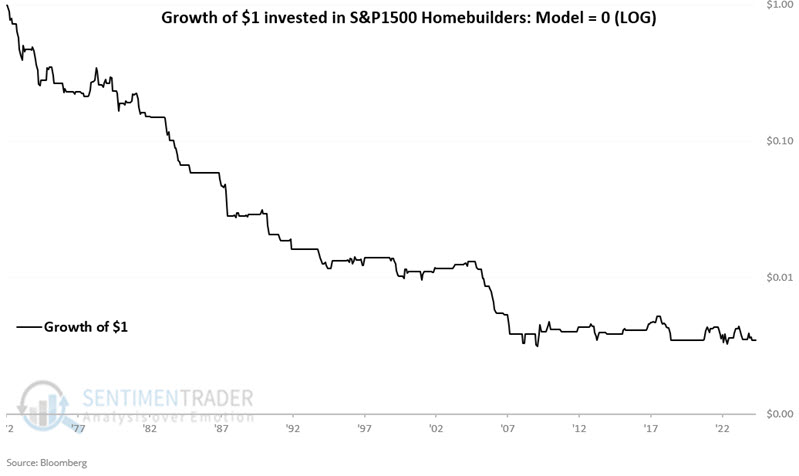
The chart below displays the hypothetical growth of $1 invested in SPHB1500 only when HBSum = 0. Since 1972, $1 has declined to $0.0035 (although it has been mostly flat since 2008).
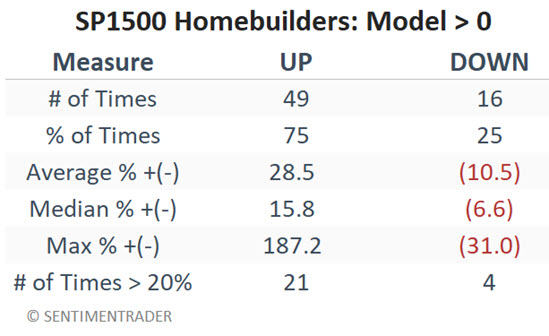
The table below displays hypothetical SPHB1500 performance during periods when HBSum is greater than 0.
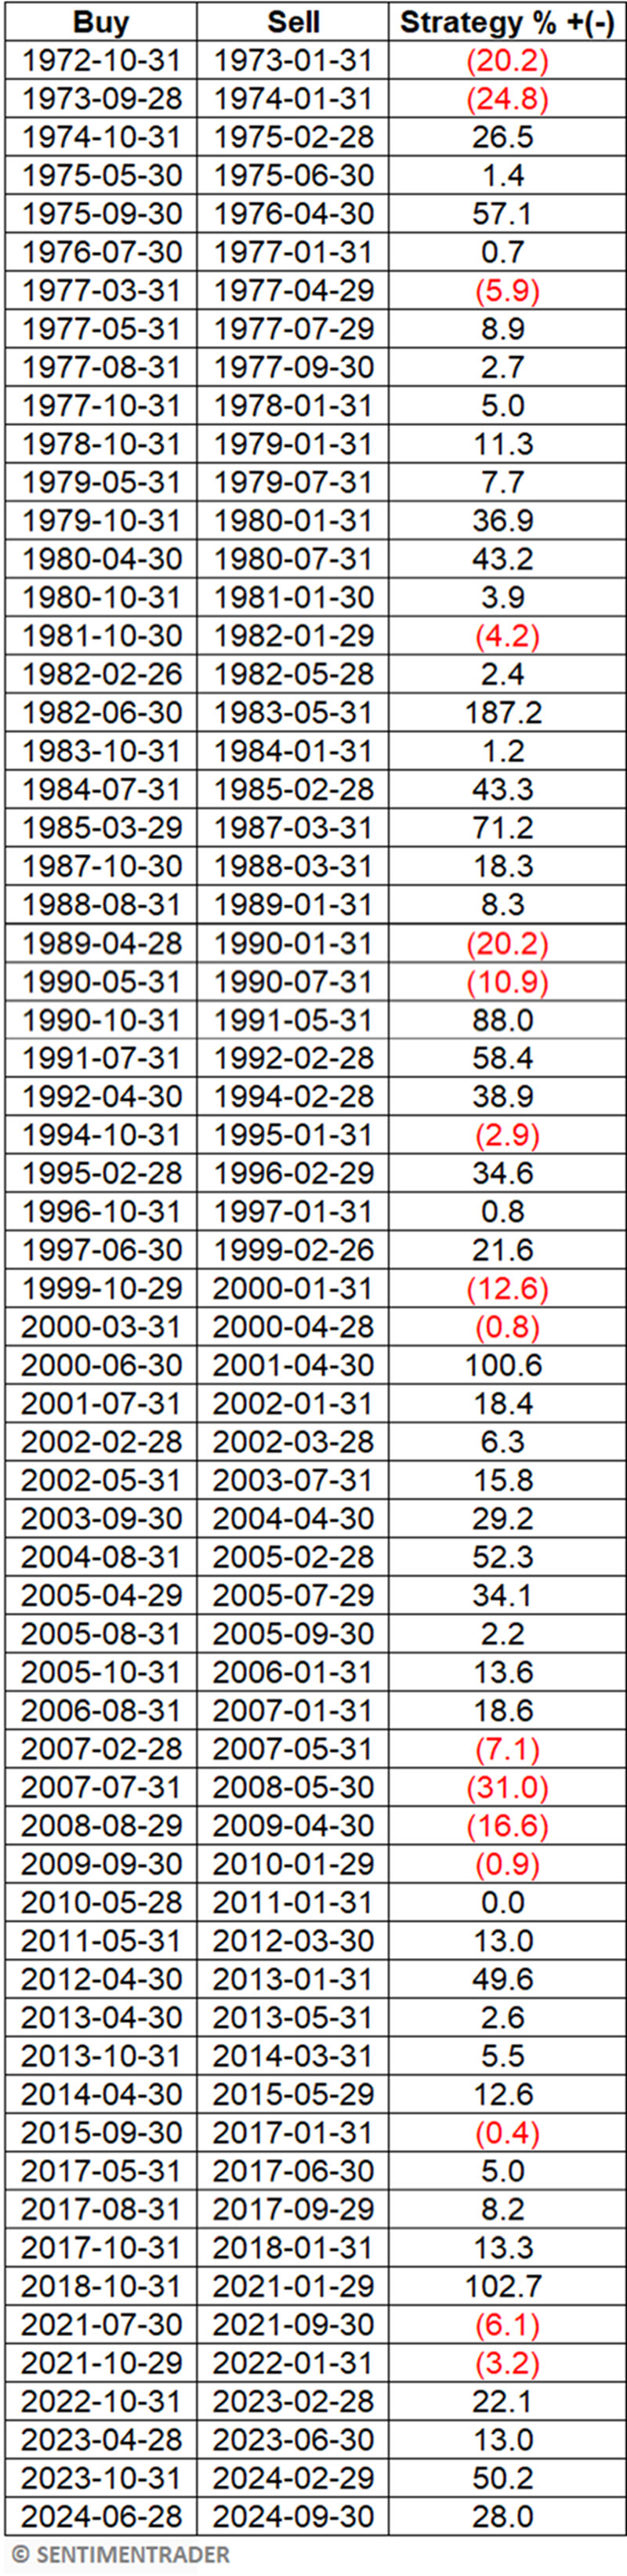
The table below summarizes performance results for the periods highlighted in the table above.
There should be no illusions that this is an "easy money, you can't lose" trading system for homebuilder stocks. The chart below displays the maximum percentage drawdown for our two-factor model (black line) versus the maximum drawdown using a buy-and-hold approach (blue line).
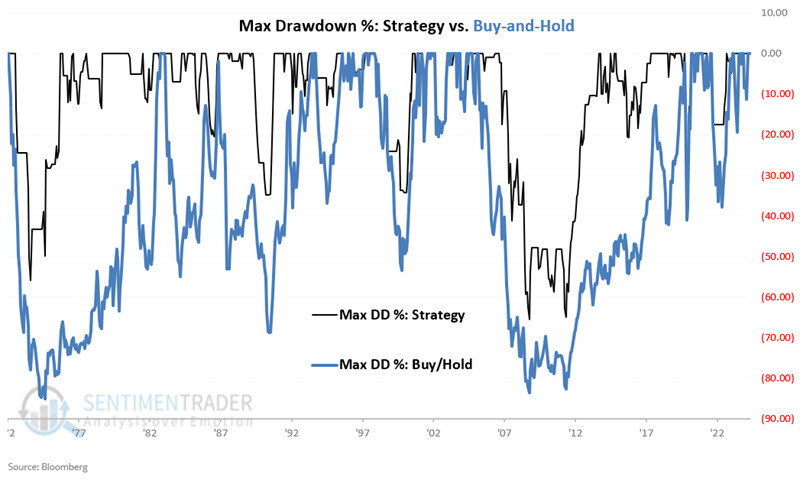
The buy-and-hold model suffered two drawdowns over -80%, with a maximum drawdown of -85.2%. The two-factor model had two drawdowns over -55%, with a maximum drawdown of -65.5%.
What the research tells us…
Interest rate trends and seasonality appear to be two key drivers regarding homebuilder stock prices. The two-factor strategy detailed above takes advantage of these factors, but investors must recognize that an enormous amount of risk remains inherent (see the drawdown numbers above). That said, avoiding homebuilders when BOTH the interest rate and seasonality factors are neutral seems like helpful information (drawdown of 99.7%!).
The interest rate factor detailed above turned favorable at the end of June 2024. The bad news is that barring a decline in the 10-year treasury yield in the days ahead, that factor will turn neutral at the end of October. The potential good news is that November 1st marks the start of the seasonally favorable November through January period, so the two-factor model will remain favorable at least through the end of January 2025. Lastly, it must be mentioned that 1 out of 4 years sees a November through January decline in homebuilder stocks. Fifteen of the last 17 November through January periods have shown a gain.