Products
SentimenTrader Trading Tools
‍
Backtest Engine
My Trading Toolkit
Correlation Analysis
Seasonality
Market Prediction
Indicators & Data API
‍
Proprietary Indicators & Charts
Market Data API
Strategies & Scanner
‍
50+ Trading Strategies
Smart Stock Scanner
Smart Option Scanner
Research Reports
‍
Research Solutions
Reports Library
Free Resources
Simple Backtest Calculator
Simple Seasonality Calculator
The Kelly Criterion Calculator
Sentiment Geo Map
Public Research Reports
Education
Sentiment Indicators
Technical Indicators
Pricing
Company
About
In the News
Testimonials
Client Success Stories
Contact
Log inLoginSign up
< BACK TO ALL REPORTS

The Historical Implications of a NASDAQ Breadth Thrust

Jay Kaeppel
2026-04-16
A recent NASDAQ Breadth Thrust bodes well for stocks in the year ahead. That's the good news. The bad news is that there are no sure things in the market. Details herein.

Key points:

  • A "Breadth Thrust" detects market momentum, and typically involves a large number of stocks advancing over a given period relative to the number of stocks declining over the same period
  • Two well-known breadth thrust indicators are the Zweig Breadth Thrust and Deemer Breakaway Momentum
  • Another such measure that fewer investors are aware of is something I refer to as NASDAQ Breadth Thrust; It recently fired a new signal

A NASDAQ Breadth Thrust Defined

I define a NASDAQ Breadth Thrust (heretofore NBT) as follows:

A = Daily NASDAQ Advances

B = Daily NASDAQ Declines

C = 10-day total of A

D = 10-day total of B

E = ((C/ (C + D)) * 100)

Variable E is simply the percentage of total advances in the last 10 trading days divided by the total of advances and declines.

A new NBT occurs when Variable E closes a day at 62% or higher. A new NBT occurred on April 14th, 2026. Does it matter?

To address the potential significance, let's consider only the first NBT in any 12 months.

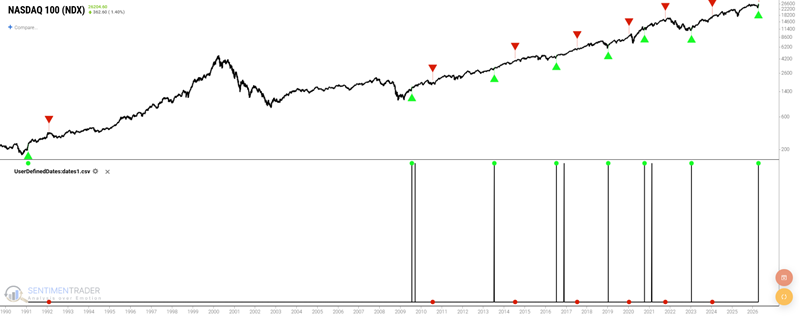
Market Action following the first NASDAQ Breadth Thrust in a year

Let's take a closer look at Backtest Edge. The chart below displays all NBT (1st in 12-month) signals. The green up arrow highlights the date

Sorry, you don't have access to this report

Upgrade your subscription plan to get access
Go to Dasboard
PRODUCTS
SentimenTrader
Trading Tools
Indicators & Data API
‍
Strategies & Scanner
‍
Research Reports
FREE
RESOUrCES
Simple Backtest
Calculator
Simple Seasonality
Calculator
The Kelly Criterion
Calculator
Sentiment Geo Map
‍
Public Research Reports
‍
Education
Sentiment Indicators
‍
Technical Indicators
‍
Pricing
Bundle pricing
‍
FAQ
‍
Announcements
‍
COMPANY
‍
About
‍
In the News
‍
Testimonials
‍
Client Success Stories
CONTACT
‍
General Inquiries
‍
Media Inquiries
‍
Financial Professionals Inquiries
‍
© 2026 Sundial Capital Research Inc. All rights reserved.
Setsail Marketing
TermsPrivacyAffiliate Program
Risk Disclosure: The information and tools provided are for research and analytical purposes only and are not intended as investment advice. Market analysis involves uncertainty, and outcomes may differ from expectations. Users should conduct their own due diligence and consider their individual circumstances before making any financial decisions. Past performance is not necessarily indicative of future results.

Hypothetical Performance Disclosure: Hypothetical performance results have many inherent limitations, some of which are described below. No representation is being made that any account will or is likely to achieve profits or losses similar to those shown; in fact, there are frequently sharp differences between hypothetical performance results and the actual results subsequently achieved by any particular trading program. One of the limitations of hypothetical performance results is that they are generally prepared with the benefit of hindsight. In addition, hypothetical trading does not involve financial risk, and no hypothetical trading record can completely account for the impact of financial risk of actual trading. for example, the ability to withstand losses or to adhere to a particular trading program in spite of trading losses are material points which can also adversely affect actual trading results. There are numerous other factors related to the markets in general or to the implementation of any specific trading program which cannot be fully accounted for in the preparation of hypothetical performance results and all which can adversely affect trading results.

Testimonial Disclosure: Testimonials appearing on this website may not be representative of other clients or customers and is not a guarantee of future performance or success.