
The highly cyclical nature of AMLP

Key points
- A master limited partnership (MLP) is a publicly-traded company that offers certain tax benefits of a private partnership
- Ticker AMLP is an ETF that tracks an index of MLPs
- Since its inception in 2011, AMLP has traded in a highly cyclical manner, which may offer opportunities for traders
MLP Overview
The acronym MLP stands for Master Limited Partnership. What's that? According to Investopedia.com:
A master limited partnership (MLP) is a business venture as a publicly traded limited partnership. It combines the tax benefits of a private partnership with the liquidity of a publicly traded company.
A master limited partnership trades on national exchanges. MLPs generally experience cash flow stability and are required by the partnership agreement to distribute a set amount of cash to investors. Their structure can also help reduce the cost of capital in capital-intensive businesses, such as the energy sector.
The Alerian MLP ETF (ticker AMLP) seeks investment results that generally correspond (before fees and expenses) to the price and yield performance of its underlying index, the Alerian MLP Infrastructure Index (AMZI). AMLP delivers exposure to the Alerian MLP Infrastructure Index (AMZI), a capped, float-adjusted, capitalization-weighted composite of energy infrastructure Master Limited Partnerships (MLPs) that earn the majority of their cash flow from midstream activities.
Price action for AMLP appears in the chart below.
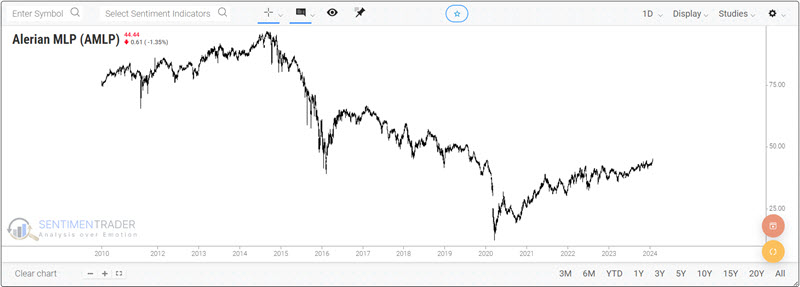
While AMLP generally trends well, there appears to be little rhyme or reason for its price fluctuations. However, as we will detail next, "under the surface," it tends to move in a relatively reliable cyclical fashion.
Cyclicality in MLPs
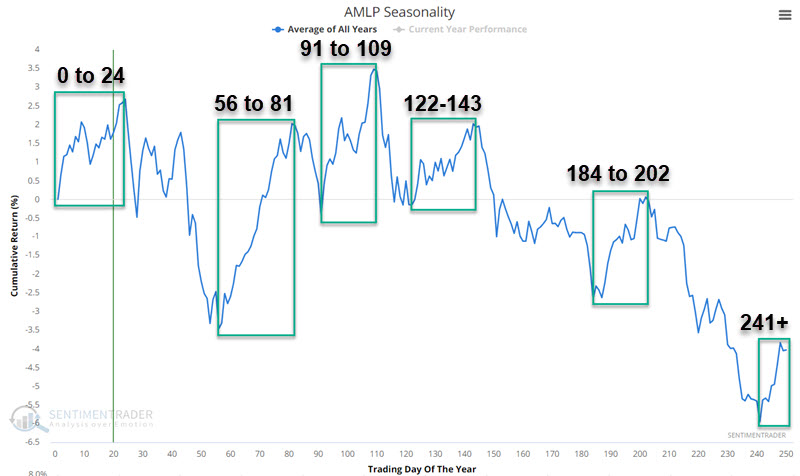
We will use ticker AMLP as our proxy as it tracks an index and is directly tradable. The chart below displays the annual seasonal trend for AMLP based on the Trading Day of the Year. Various generally favorable periods are highlighted in the green boxes.
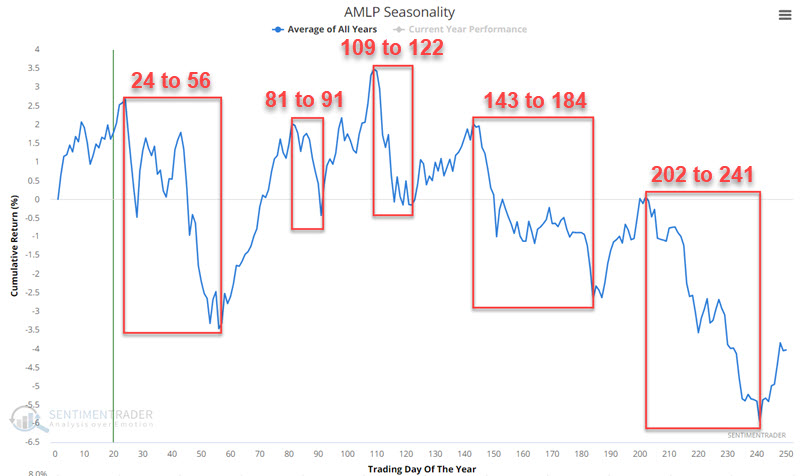
Conversely, the chart below displays the annual seasonal trend for AMLP with various generally unfavorable periods highlighted in the red boxes.
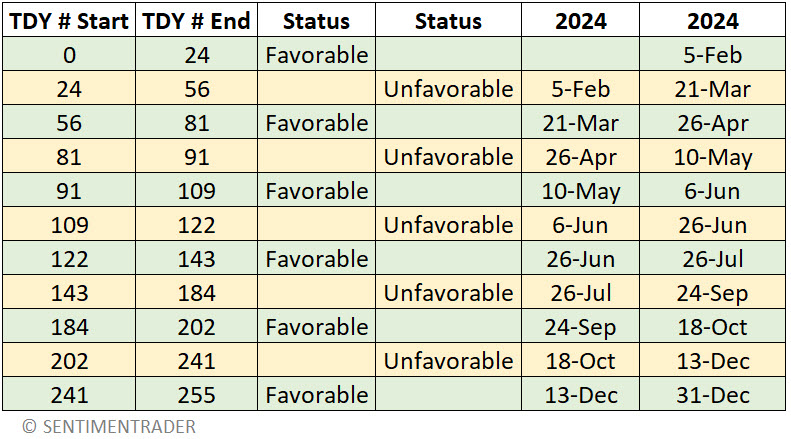
The table below breaks down these favorable and unfavorable periods based on the Trading Day of the Year number (TDY). Note that the first and last favorable periods tie together a favorable period that runs from late in one year to early in the next year. The relevant dates for 2024 appear in the two right-hand columns.
A closer look at the results
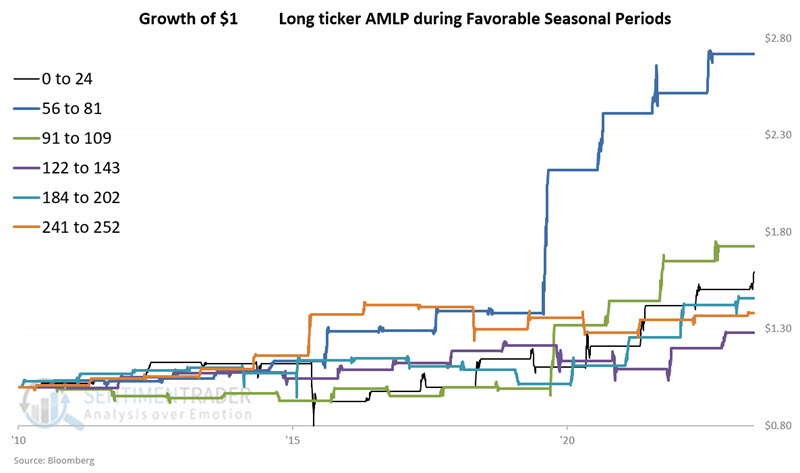
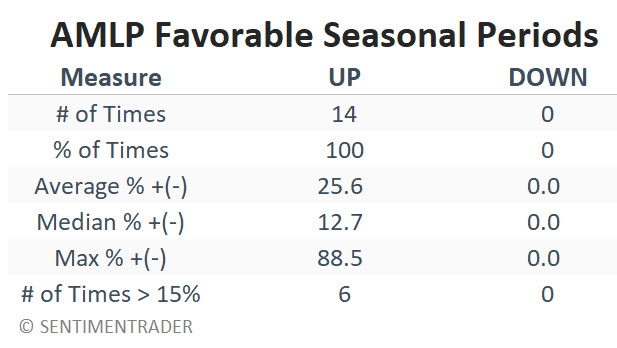
The chart below displays the growth of $1 invested in AMLP during each of the favorable periods highlighted in the table above. While each period is far from perfect, they all have trended higher over time.
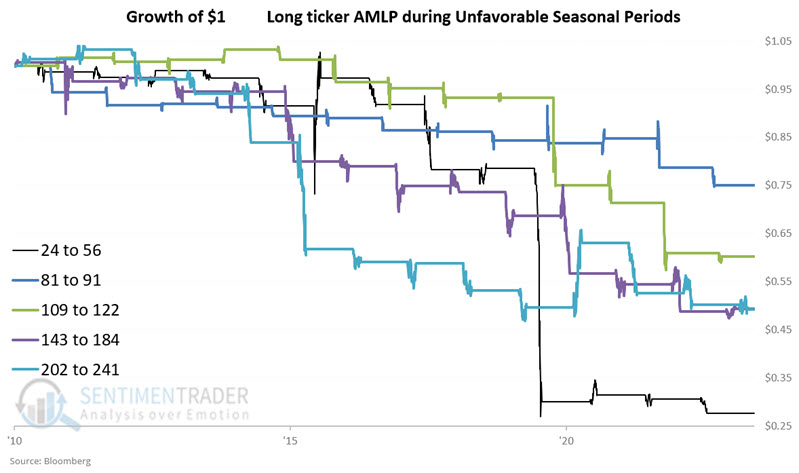
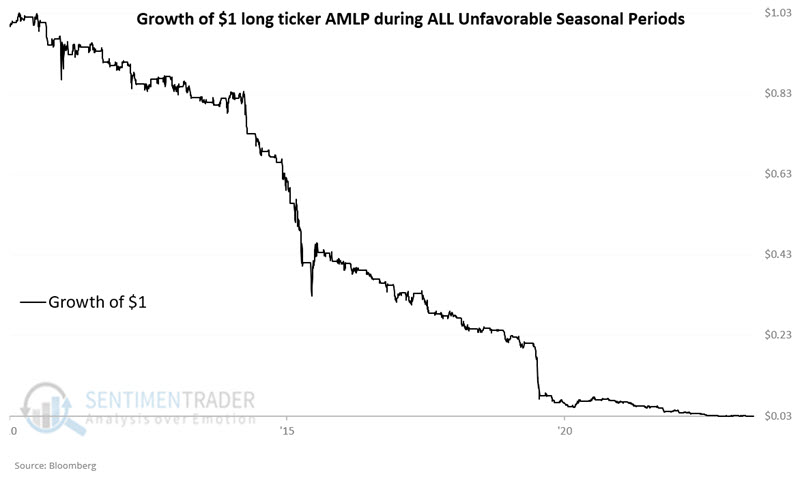
On the other hand, the chart below displays the growth of $1 invested in AMLP during each unfavorable period highlighted in the table above. Each of these periods shows a decline in equity.
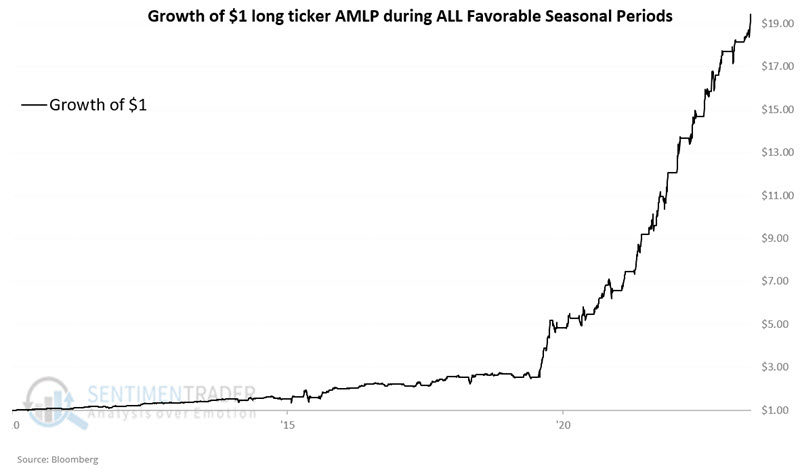
Now, let's combine all of the favorable seasonal periods. The table below displays the hypothetical growth of $1 invested in AMLP only during the favorable periods listed above each year since AMLP started trading in 2010. The cumulative hypothetical gain is +1,845%. Buy and hold since inception returned -40.6%.
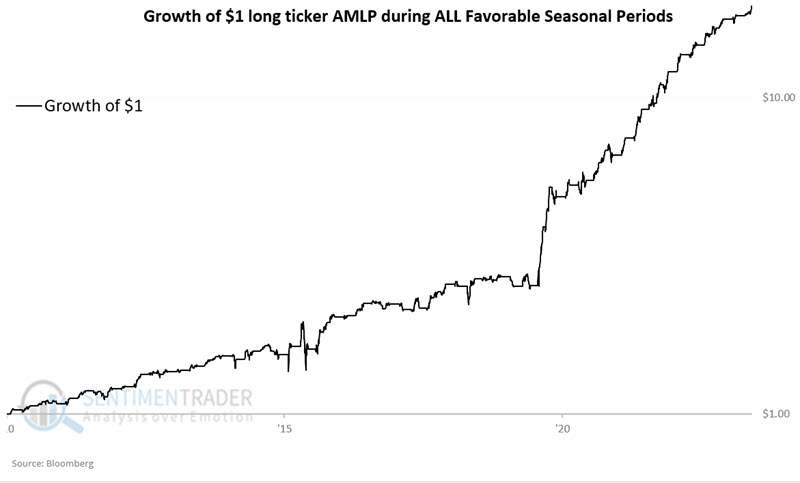
The chart below displays the same results as the chart above on a logarithmic scale.
Now, let's combine all of the unfavorable seasonal periods. The table below displays the hypothetical growth of $1 invested in AMLP only during the unfavorable periods listed above each year since AMLP started trading in 2010. The cumulative hypothetical loss is -96.9%.
Summarizing results
This is a reminder that all results shown here are hypothetical but are based on holding a long position in AMLP during repetitive favorable (or unfavorable) periods each year. The table below displays the annual returns from holding AMLP only during favorable and unfavorable periods.
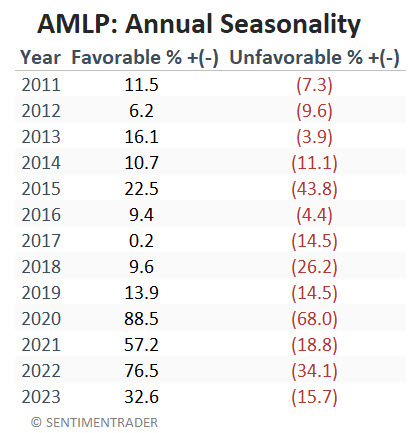
We see some compelling numbers in the table below if we look at annual results (starting with the first full year of trading in 2011) and focus solely on holding AMLP during favorable periods.
So far, AMLP is up roughly +4.8% in 2024. The currently favorable period ends at the close of TDY #24 (2024-02-05). The next unfavorable period (TDY #24 through TDY #56) extends from 2024-02-05 through 2024-03-21.
The important caveats
The results above are compelling. However, before one starts getting stars in their eyes, it is essential to consider two things. 1) These results - while based on objective, repetitive cyclical periods - are hypothetical and not real-world results; 2) there can still be sizeable volatility and drawdowns that might be beyond the maximum pain threshold for a given trader.
The table below displays the maximum drawdowns a trader would have experienced had they been long AMLP during all favorable periods since trading inception.
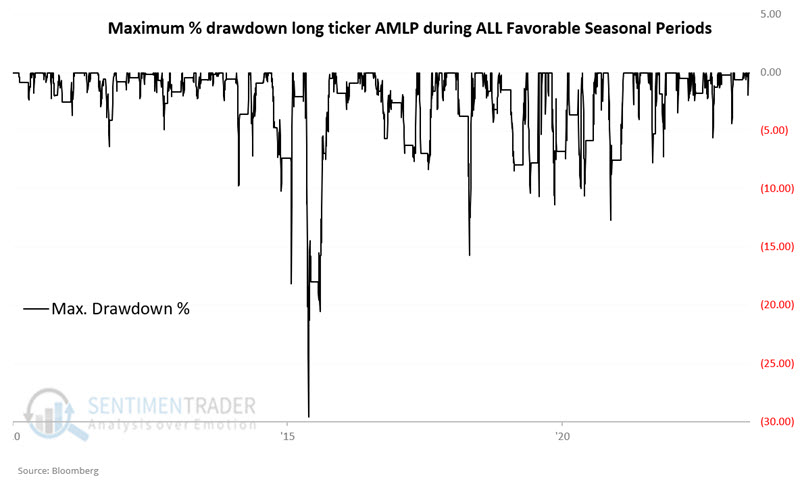
Quick, sharp drawdowns of at least -10% are essentially "standard operating procedure." Also note that the maximum drawdown so far is -29.6%. This harrowing decline unfolded in just 11 trading days from 2016-01-04 through 2016-01-20. Continuing to trade any strategy through that type of action is one of the most significant challenges any trade might face.
A reminder: No backtest or past performance ever guarantees future results. Likewise, individual traders are never relieved of their responsibility to allocate capital intelligently and manage risk responsibly.
What the research tells us…
A reminder: No backtest or past performance ever guarantees future results. Likewise, individual traders are never relieved of their responsibility to allocate capital intelligently and manage risk responsibly.
AMLP is a highly cyclical security. So far, the periods highlighted in our Annual Seasonal Trend charts have done an excellent job of capturing favorable and unfavorable periods, respectively. While there can never be any guarantee that AMLP will rally during a given "favorable" period, historical results strongly argue that one better have a good reason to hold a long position during an "unfavorable" period.