
The Hang Seng Index triggers a breadth thrust buy signal

Key points:
- The percentage of Hang Seng Index members above their 50-day average exceeded 90%
- After similar thrusts, the Index was higher on a medium to long-term basis, especially after bear markets
- Several other breadth-based indicators are improving around the globe
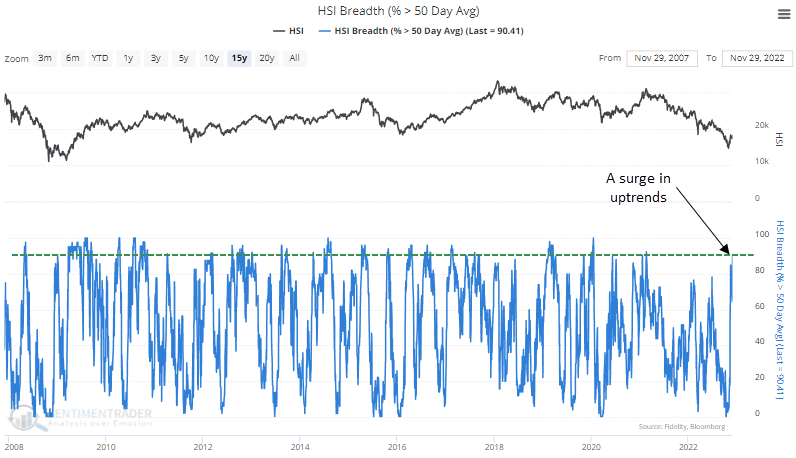
A significant number of Hang Seng Index members are now in medium-term uptrends
The Hang Seng Index joined the breadth thrust party this week when the percentage of Index members trading above their 50-day average exceeded 90%.
The surge in medium-term uptrends represents the highest level of participation from Index members in more than 20 months. And it confirms several other bullish developments for Chinese-based stocks, which we highlighted recently.
Please click here, here, and here for the other notes.
Similar surges preceded positive medium and long-term returns
When the percentage of Hang Seng Index members above their 50-day average exceeds 90%, the popular Hong Kong Index tends to increase in value over most time frames. With the Index up a significant amount since its recent low, I wouldn't be surprised if we saw some backing and filling, especially since v-bottoms are rare.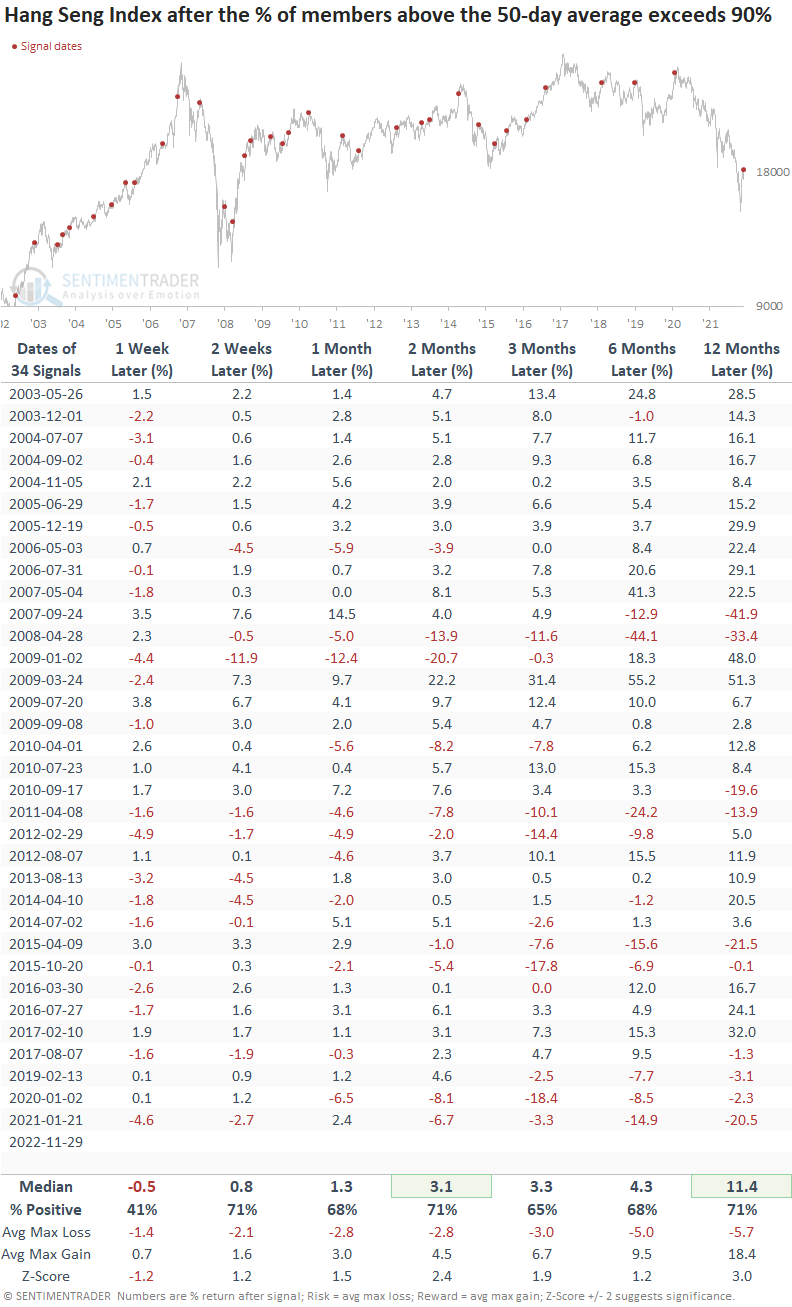
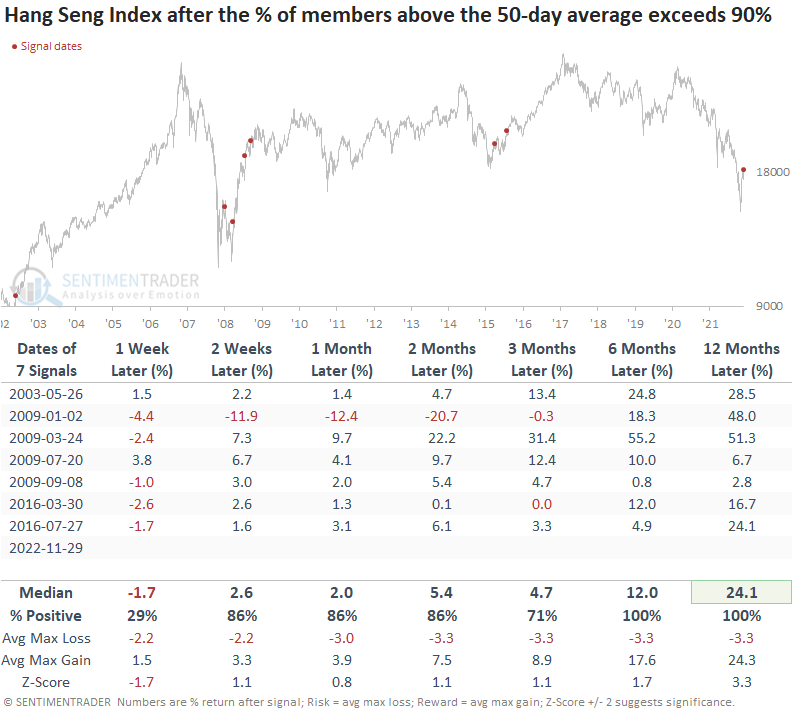
Signals that occurred with the Hang Seng down > 20% from a multi-year high
With sentiment as bad as it gets after a 50% drawdown in 22 months, let's isolate signals when the Hang Seng Index was down 20% or more from a multi-year high at the time of an alert. While the 1-week time frame once again shows the Index typically pulls back after the burst in participation, the medium and long-term results look excellent.
The January 2009 signal suffered a significant drawdown. However, the Hang Seng Index remained above the October low. Sometimes, the initial breadth thrust signal breaks the downside momentum and sets the stage for a meaningful trend change when a second alert occurs.
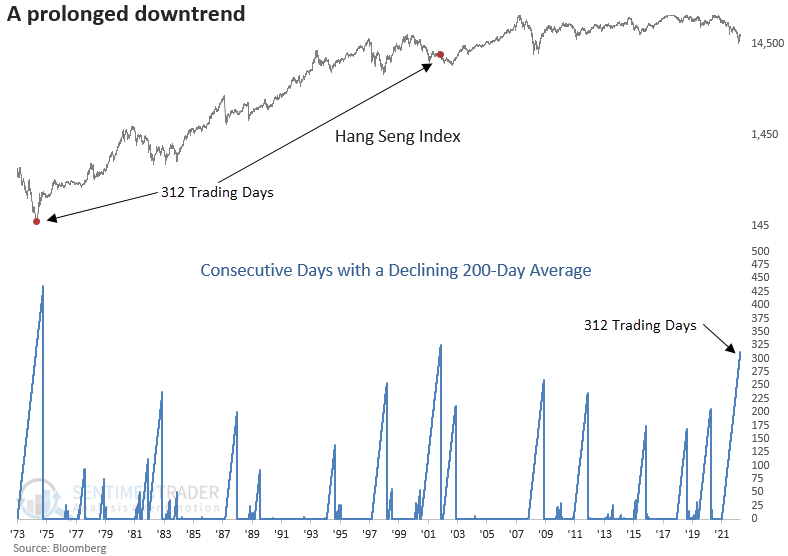
Big-picture trend perspective
The Hang Seng Index has now closed below its 200-day average for 312 consecutive days, the third long streak in history. While the 1974 instance almost marked the low, in 2002, the Index continued to fall for an additional ten months.
What's different this time
Whether local currency indexes or USD-based ETFs, the upside participation since the October low has shown meaningful improvement across different indicators and input duration lengths. The change in character is more notable than the June to August bear market bounce.
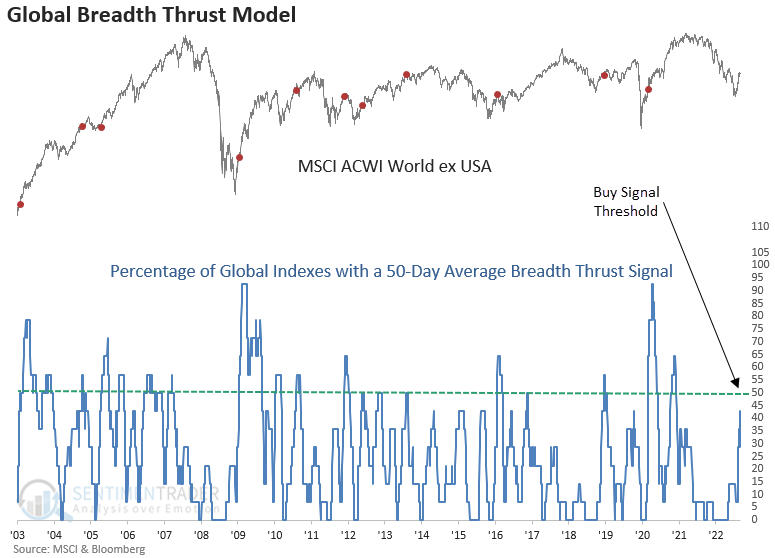
While I monitor the percentage of members trading above their 50-day average on an individual index basis around the globe, I also created a composite model for a basket of indexes. The composite measures the percentage of indexes on a 50-day average buy signal over the last two months. i.e., when the individual indexes have more than 90% of their members above the 50-day average.
The composite reading has risen to the highest level this year and is approaching the threshold for a buy signal. The DAX, CAC, and FTSE indexes are a few of the other recent alerts.
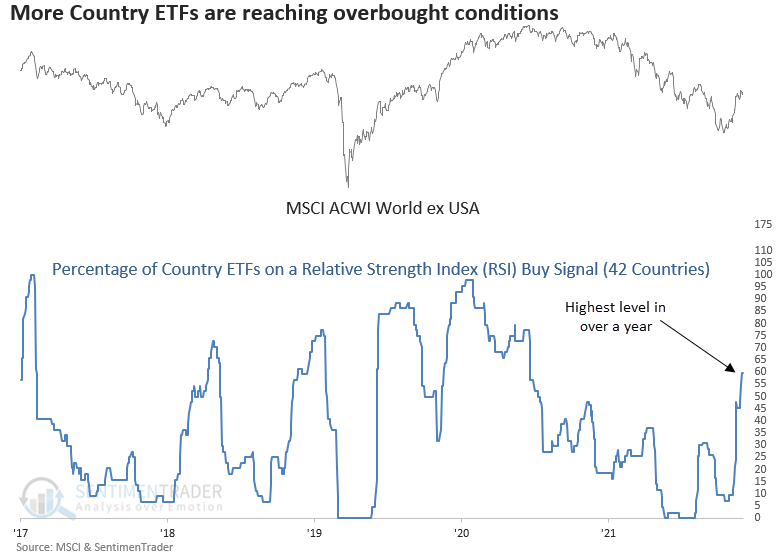
An additional indicator showing a notable change in character is the percentage of Country ETFs on a Relative Strength Index (RSI) buy signal. An alert occurs when an ETF's RSI indicator crosses above 70 and stays in effect until the RSI crosses below 34. An RSI reading of 70 is a sign of bullish market momentum.
The series has risen to the highest level in over a year.
What the research tells us...
The percentage of Hang Seng Index members trading above their 50-day average surged above 90%, triggering a breadth thrust buy signal. While thrust signals have struggled in the current environment, this time could be different. Hong Kong stocks have been in a prolonged downtrend, and breadth measures are improving across the globe.