
The granddaddy of market breadth indicators triggered a warning

Key points:
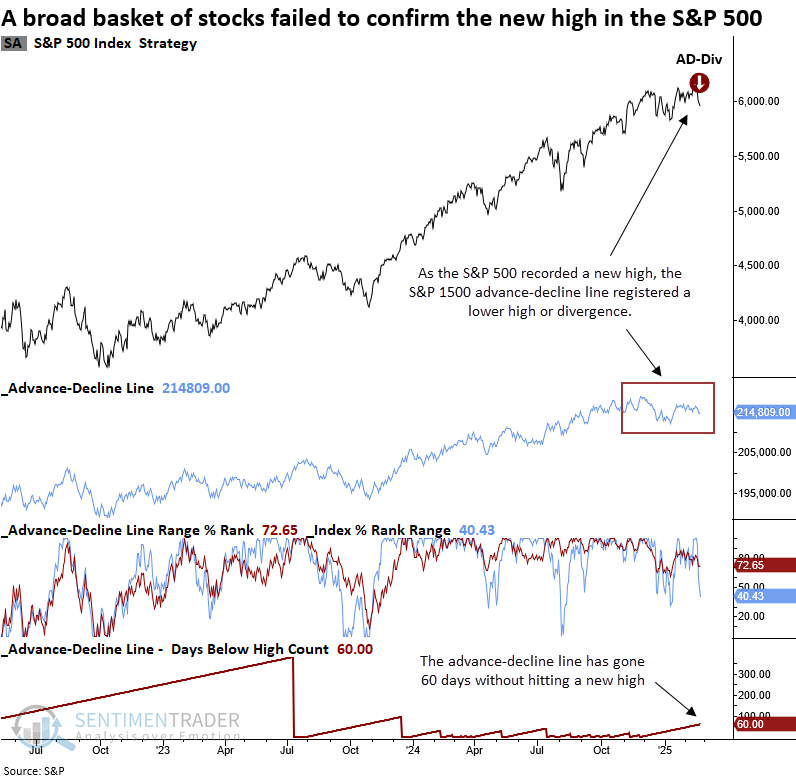
- The advance-decline line for the S&P 1500 triggered a warning as the indicator failed to confirm new highs
- Comparable divergences suggest stocks could struggle over the subsequent three months
- High-yield bonds flashed a caution signal as their advance-decline line was unable to confirm new highs
A critical market breadth indicator shows stocks diverging from broad indexes
The advance-decline line is considered the granddaddy of market breadth indicators. It charts the cumulative sum of the daily difference between advancing and declining issues. The indicator rises when advancing issues outnumber declining ones and falls when the reverse occurs.
When an index achieves a new high, it should be accompanied by a new high in the advance-decline line. If this confirmation is absent, technical analysts consider it a divergence.
Like all market breadth indicators, when these non-confirmations or participation problems arise, it's a warning that a potential bullish-to-bearish index trend change could emerge. Although the advance-decline line is an excellent indicator that has provided numerous warnings ahead of significant corrections and bear markets, there is no guarantee that it will foreshadow a trend change.
Advance-decline line warnings are rare. The previous signal for the S&P 1500 version, which monitors small, mid, and large capitalization stocks, occurred in October 2007, providing a timely alert ahead of the GFC-driven bear market. Before that instance, a signal was generated in January 2000, preceding the Dotcom bust.
The divergence system functions in two stages. First, condition one is met if the index's two-year range rank reaches 100% as the advance-decline line rank remains below a user-defined threshold. Then, a signal is generated if, within 10 sessions, the index registers a 15-day low and the advance-decline line has not achieved a new high in at least 30 days.
Since the S&P 1500 index was established in 1995, the S&P 500 has been utilized as the index component in the system due to its extended history. If you were wondering, had the S&P 1500 been used, it would have generated a signal.
Similar divergences preceded an unfavorable outlook over a medium-term horizon
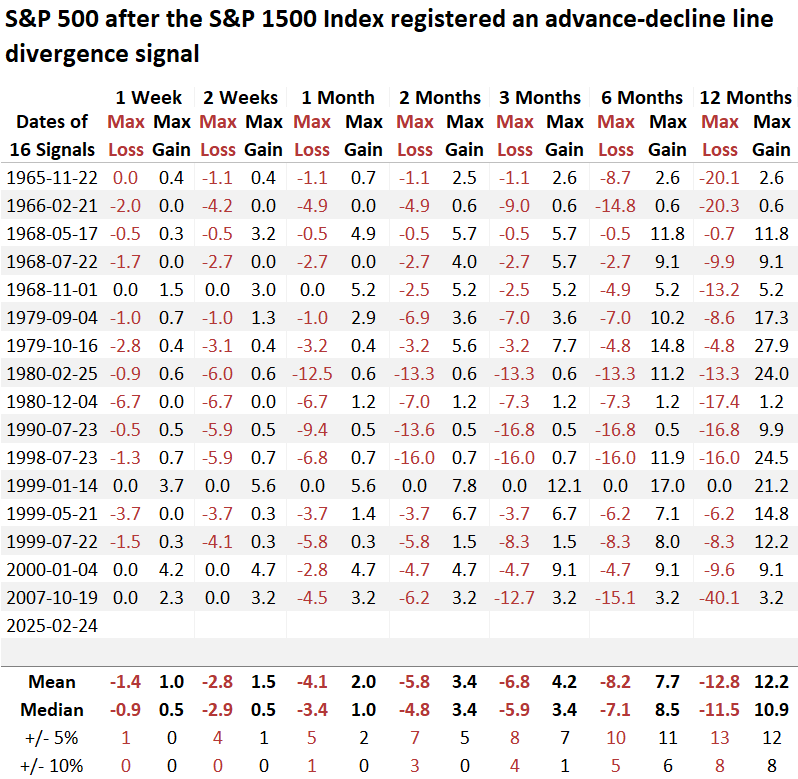
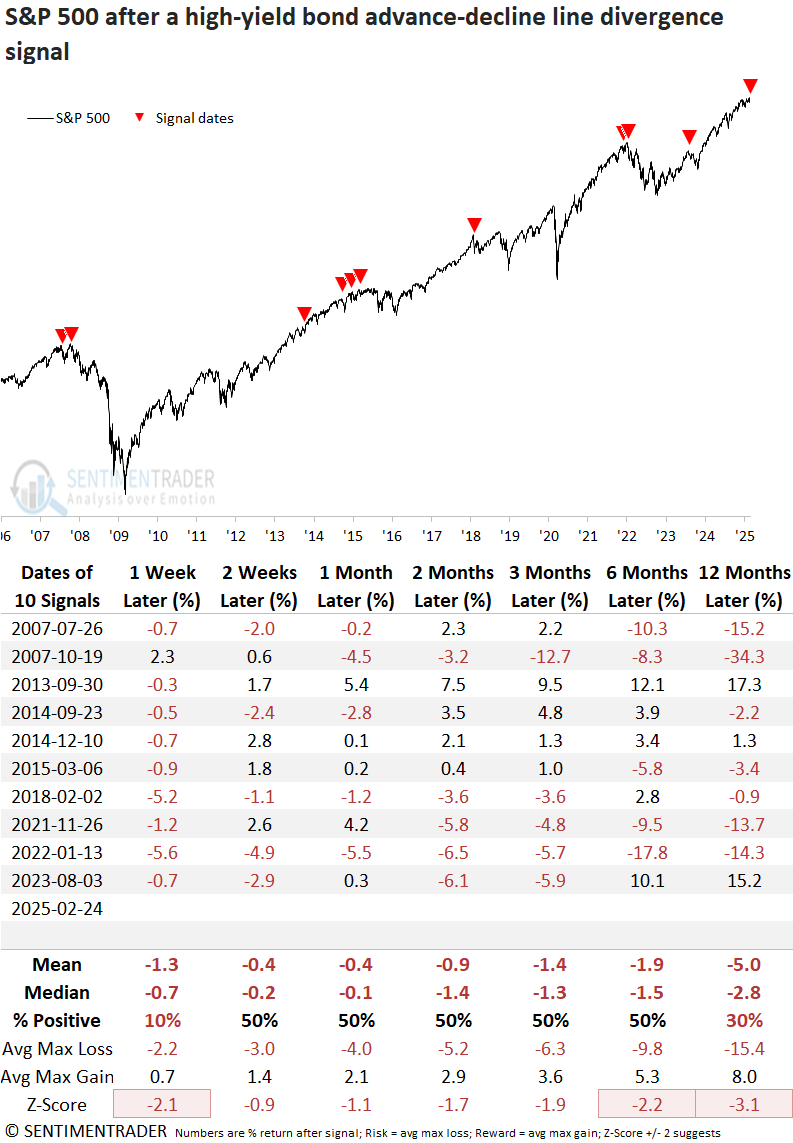
Whenever the S&P 1500 index triggered an advance-decline line divergence signal, the world's most benchmarked index struggled over the following three months. The most pronounced weakness emerged at the two-month mark, where returns significantly trailed random performance. Moreover, across all timeframes, the average maximum loss outweighed the maximum gain, highlighting a skewed risk-reward profile.
Four precedents from the 1998-1999 period illustrate how divergences can linger, challenging traders' mindsets.
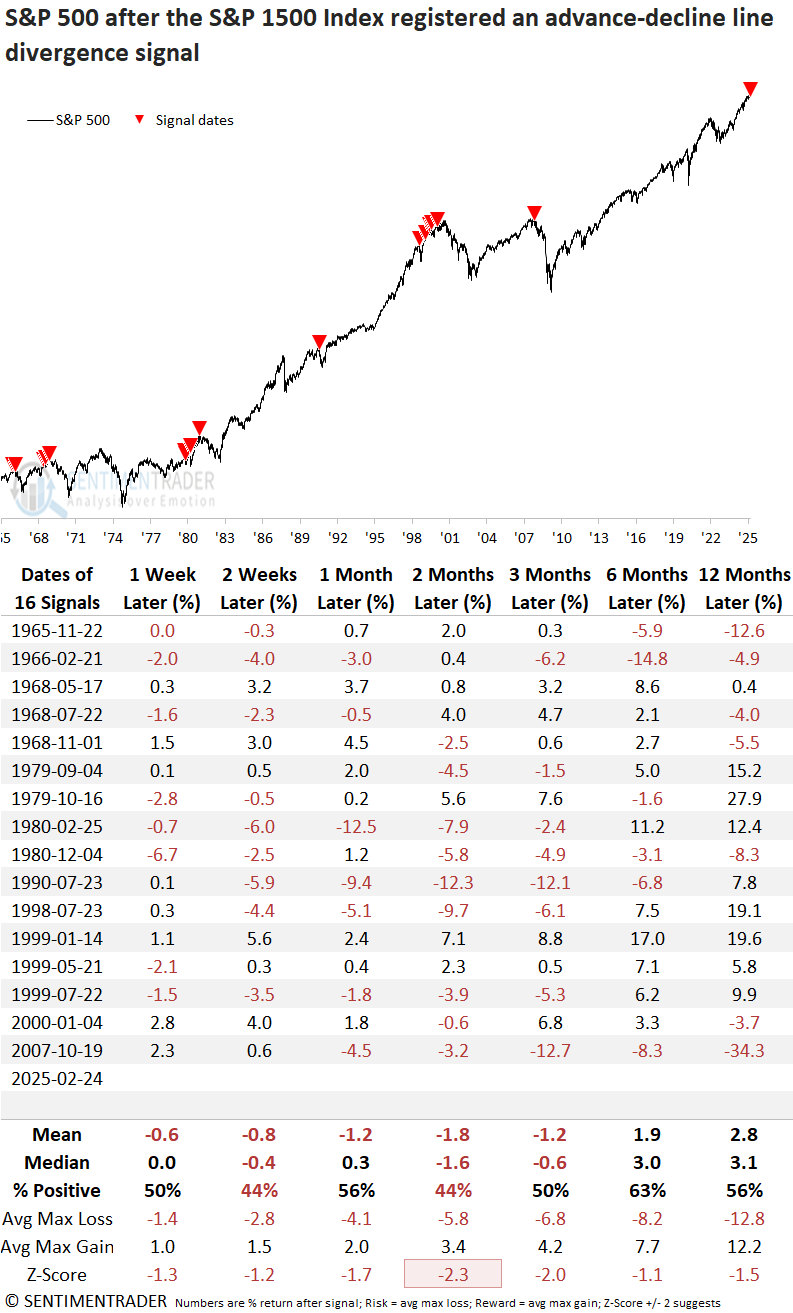
Over the subsequent twelve months, half of the historical cases experienced a maximum loss exceeding 10%.
A warning from economically sensitive high-yield bonds
The advance-decline line divergence system for high-yield bonds issued a cautionary signal, indicating that these economically sensitive corporate bonds, which correlate closely to equities, failed to validate the S&P 500's new high.
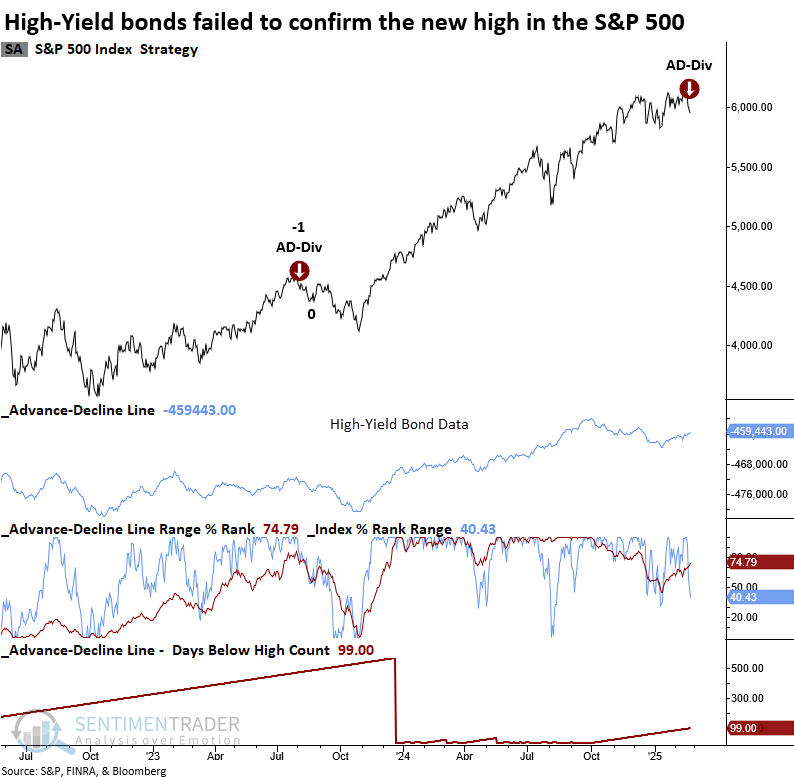
Although the sample size is small due to data limitations, when high-yield bonds trigger an advance-decline line warning, the S&P 500 catches a cold. Comparable alerts saw the world's most benchmarked index struggle across all time frames.
Like the equities version, this series can produce multiple signals before the market moves lower.
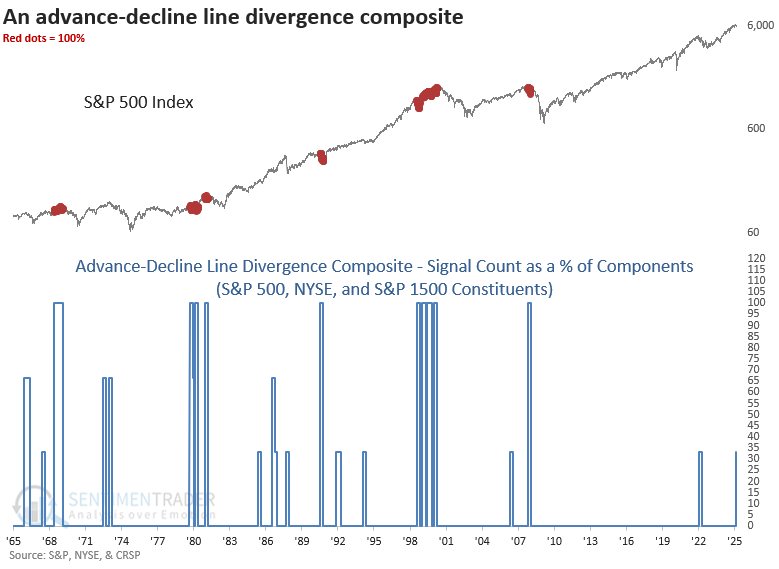
As I stated in my report on Monday, I track the advance-decline line divergence system across multiple indexes and exchanges. The following composite combines the S&P 500, S&P 1500, and NYSE models. Although one signal can foreshadow a significant stock index decline, as in 2022 when the NYSE version triggered an alert, the likelihood of a bear market accompanied by an economic contraction increases when all three flash a warning.
As a reminder, the TCTM Risk Warning Model component uses NYSE data to identify a divergence signal.
What the research tells us...
A system that tracks the advance-decline line for the S&P 1500 triggered a warning when the breadth-based indicator failed to confirm the new high in the S&P 500. Similar divergences suggest equities could face headwinds over a medium-term horizon. Furthermore, several precedents preceded or coincided with significant market peaks. High-yield bonds, known for their economic sensitivity, also triggered a divergence alert, potentially suggesting that the same macro factor impacting S&P 1500 equities could be weighing on riskier corporate bonds. If the S&P 500 and NYSE breadth models also flash warnings in the near future, the probability of a broader market trend shift would increase, warranting close attention from investors.
Note: I'm on vacation next week. So, I won't be publishing any reports.