
The good and bad for financials

Key points
- The financial sector has been roiled in recent months by a series of bank failures
- Several critical indicators suggest that the fear is getting overdone and that a buying opportunity is at hand
- Other indicators suggest that more patience is in order before diving in heavily
The current state of affairs
Between mid-January 2023 and early May, the Financial Select Sector SPDR Fund (XLF), the SPDR S&P Bank ETF (KBE), and the SPDR S&P Regional Banking ETF (KRE) lost -27%, -49%, and -56%, respectively. Investors are now wondering if the selloff has created a buying opportunity or if things will get much worse before they get better.
Seasonality is an initial overarching concern
The chart below displays the annual seasonal trend for ticker XLF. The cause for concern is apparent, as the June through October period tends to show little upside bias.
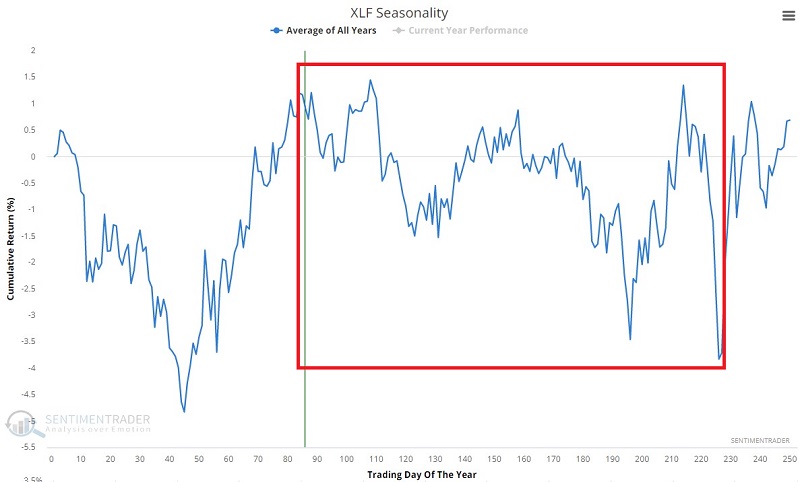
As always, the annual seasonal trend only represents an average of what has happened in the past and is not a roadmap for the current year. The bottom line: seasonality falls on the unfavorable side of the ledger.
Financial sector insiders see a buying opportunity
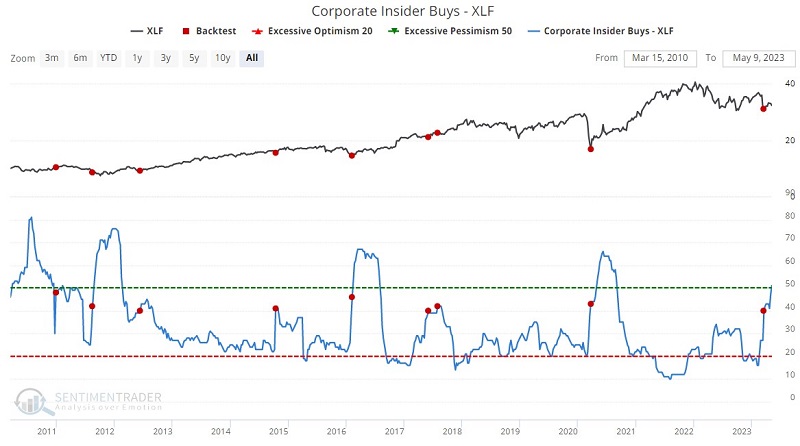
First, the good news: corporate insiders in the financial sector appear to be using the recent dip as a buying opportunity by adding to their positions via open market purchases. Significantly one-sided insider actions are rarely wrong over one to three years. The bad news is that insiders are often early. So while increased buying may prove favorable in the years ahead, it does not preclude the possibility of things worsening in the meantime.
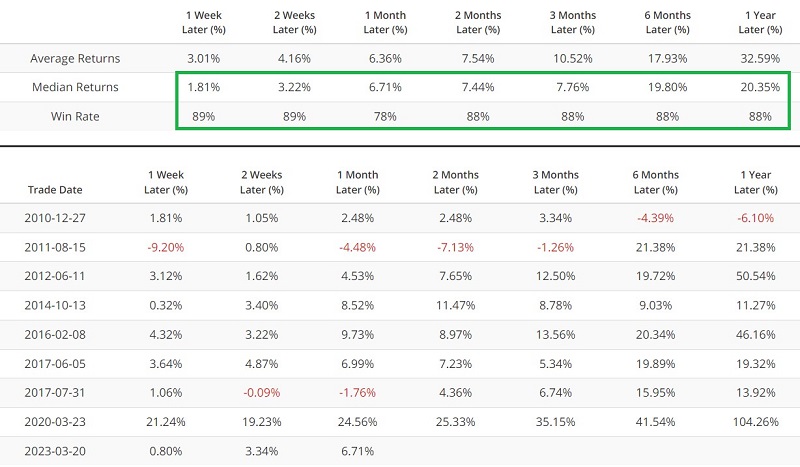
The chart and table below display XLF action following those times when our Corporate Insider Buys - XLF indicator crossed above 39.9.
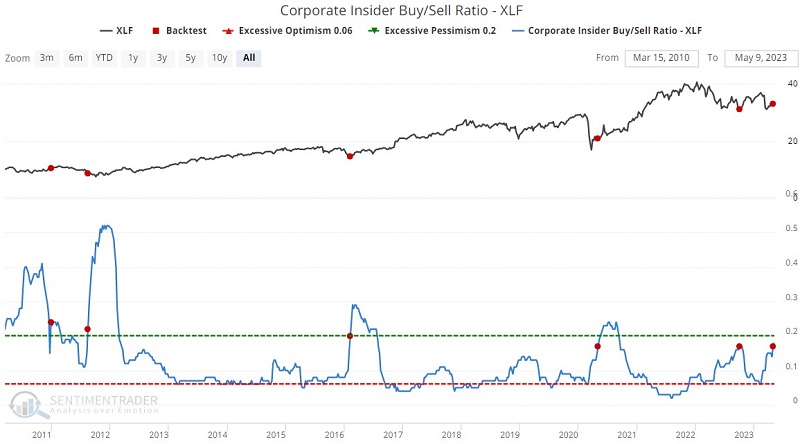
The chart and table below display XLF action following those times when our Corporate Insider Buy/Sell Ratio - XLF indicator crossed above 16.9.
As always, there are no guarantees. But the type of recent action we have seen from financial corporate insiders has been decidedly bullish in the past.
A favorable signal from an unexpected source
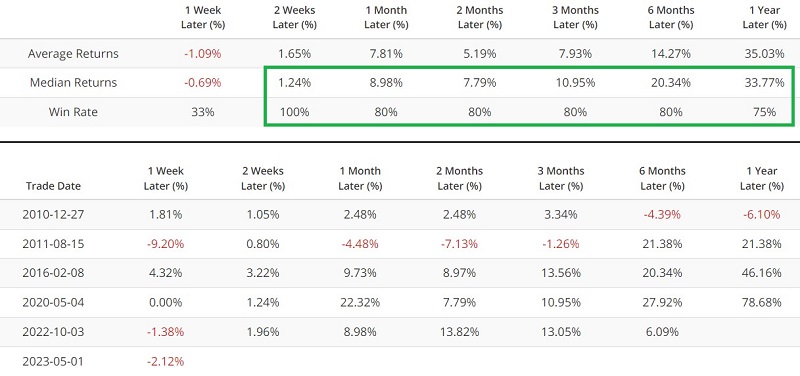
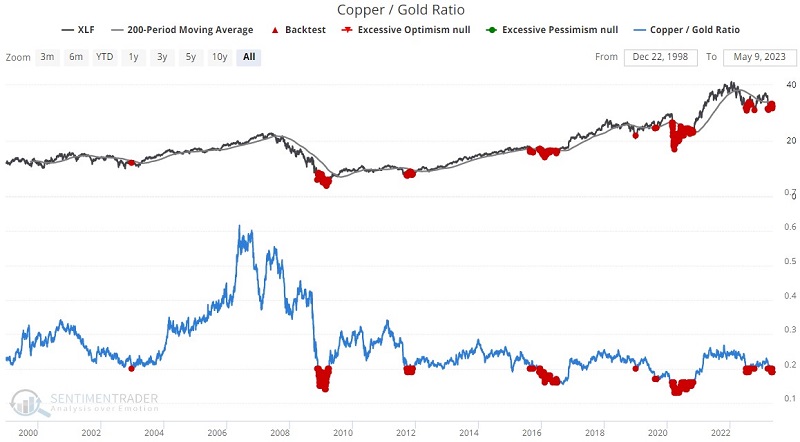
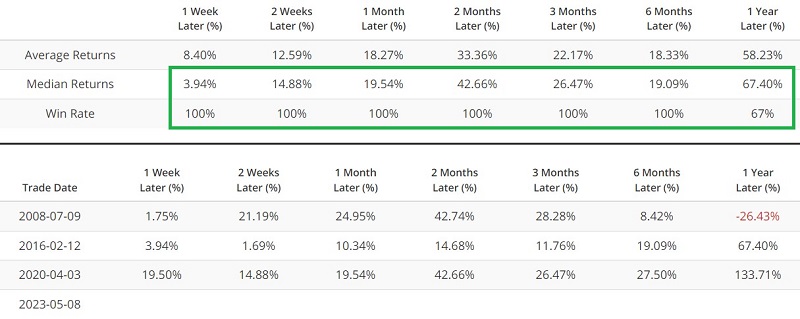
The chart and table below display XLF action following all dates when the copper/gold ratio was below 0.20, AND ticker XLF was trading below its 200-day moving average.
It is a mistake to look at the table above and assume that there is a 99% chance that XLF will rally 50% in the next year. But history suggests keeping an open mind to the potential for a strong rebound.
Sentiment is getting extremely bearish in the banking sector
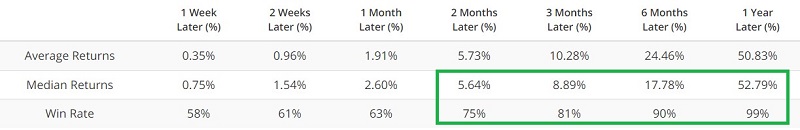
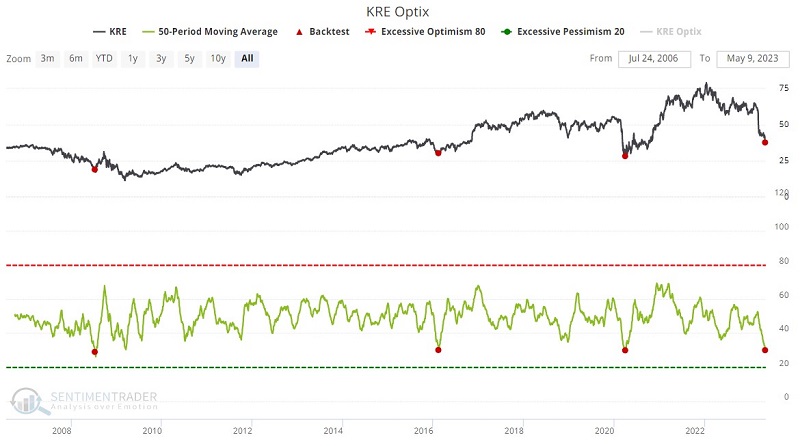
If we look specifically at the banking sector, we find that sentiment is beginning to reach a bearish extreme - which tends to be a favorable contrarian sign. The chart and table below display those times when the 50-day average of our KRE Optix indicator has dropped below 30.1.
For the record, previous instances were not accompanied by a series of significant bank foreclosures, so yes, it could be different this time. Like the copper/gold indicator above, this one is viewed best not as a "buy" signal but as an "open your mind to the possibility of buying" signal. Likewise, the small sample size suggests investors do not get too starry-eyed based on previous average and median returns.
Now let's look at some lingering warning signs.
An increase in XLF new lows tends to be unfavorable
It should not be surprising that the number of XLF constituents making new 52-week lows has increased. The bad news is that this weakness often presages further interim weakness. The chart and table below display those times when our XLF New Low % indicator crossed above 20% for the first time in 60 days.
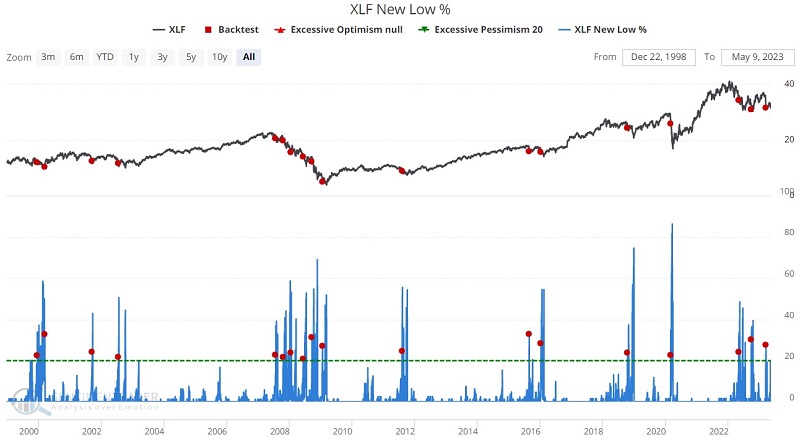
Lackluster returns have often lasted for six months or more following previous signals.
An unfavorable signal from an unexpected source
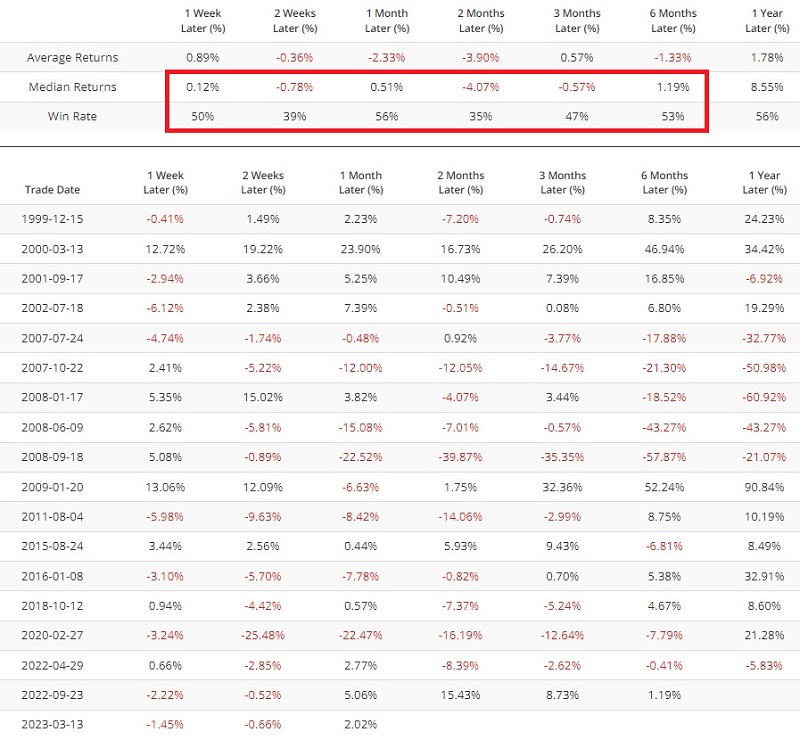
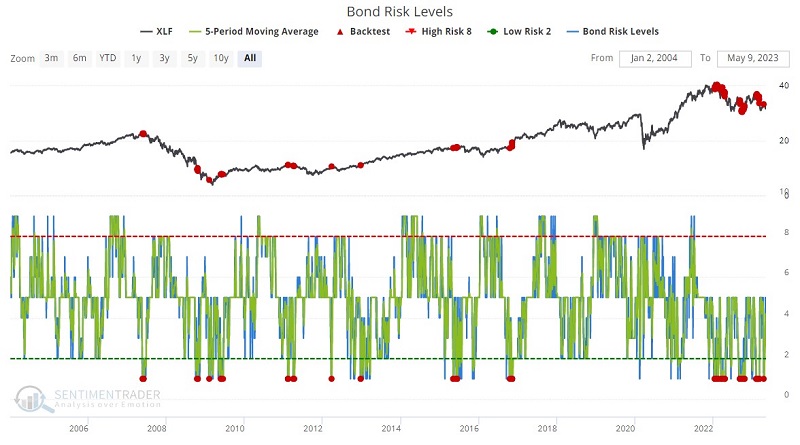
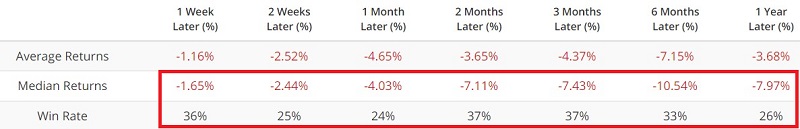
The financial sector is highly related to interest rates. In an unexpected twist, when our Bond Risk Levels indicator has fallen to a low level, financial stocks have tended to perform quite poorly. The chart and table below display those times when the 5-day average of our Bond Risk Levels indicator was equal to 1.
What the research tells us…
The net result of the information above is something of a mixed bag. Several indicators are highly favorable, while others suggest continued caution. Anytime corporate insiders act bullish on a given sector, paying close attention is a good idea. At this point, it is impossible to know if the recent island lows put in by XLF, KRE, and KBE will hold. Aggressive investors might consider establishing a position in hopes of a strong rebound. Less aggressive investors should open their minds to the possibility of buying but might consider waiting for some sign of an actual reversal in the recent bearish action.