
The Gold Miner Calendar - Part III

Key points
- In Part I, we highlighted four-year favorable year performance versus the four-year unfavorable year performance
- In Part II, we added two refinements to create an actual gold miner investment calendar
- In Part III, we will detail the actual Gold Miner Calendar and related gold mining stock performance
- The Calendar may be used as a standalone trading model, but realistically, it might be best suited as part of a weight-of-the-evidence approach
An Overview of Gold Miner Calendar Factors
- An alternating eight-year cycle began on 1961-01-01, with the first four years considered favorable and the second four years considered unfavorable
- The first full "favorable" four-year period ran from 1961-01-01 through 1964-12-31. The first full "unfavorable" four-year period ran from 1965-01-01 through 1968-12-31.
- The latest "unfavorable" period began on 2021-01-01 and will run through 2024-12-31. The next "favorable" period will run from 2025-01-01 through 2028-12-31.
- During favorable years, gold miners are held all months except October
- During unfavorable years, gold miners are held only during January, February, November, and December
The Gold Miner Calendar
The table below displays the complete eight-year Gold Miner Calendar. The current eight-year cycle began on 2017-01-01 and will end on 2024-12-31. The current cycle is in November of the 7th year, as highlighted in green. 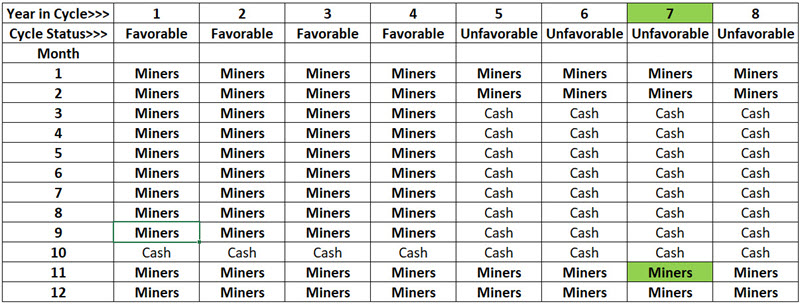
Per this Calendar, gold miners will be held through the end of February 2024 and then sold. They will not be repurchased until the close of the last trading day of October 2024.
Let's look at the historical backtest.
Backtest Results
The results below are based on daily price fluctuations for the Gold Bugs Index (Ticker HUI). It should be noted that HUI is an index and cannot be invested in directly. An investor could get highly correlated exposure to gold mining stocks by trading the VanEck Gold Miners ETF (ticker GDX) or Fidelity Select Gold Fund (FSAGX), among others.
The results below are based on a hypothetical test and do not reflect a real money account. Results are based on holding ticker HUI only during the months marked "Miners" in the table above across each eight-year cycle. No assumption should be made that future results will match the back-tested results shown below.
For this test, any month labeled "Miners" in the calendar above is considered a "favorable" month, regardless of whether it occurs during the first four or last four years of the eight-year cycle.
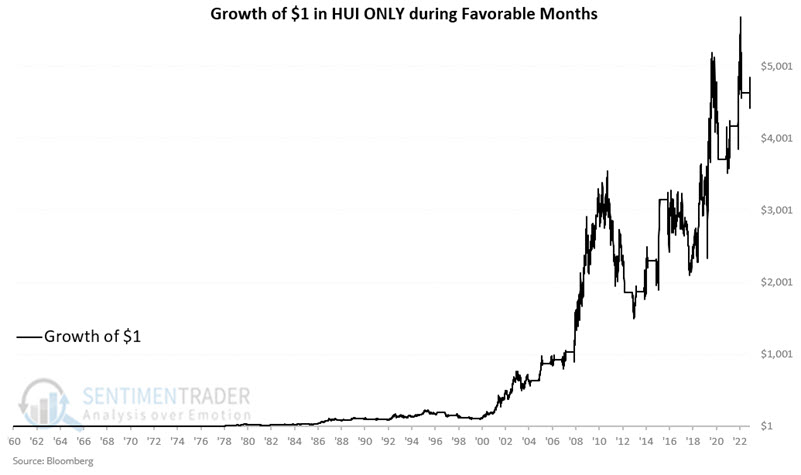
The chart below displays the hypothetical growth of $1 invested in ticker HUI only during favorable months (for all other months, no gain or loss is accrued. In real-world trading, the account would likely earn some interest in cash).
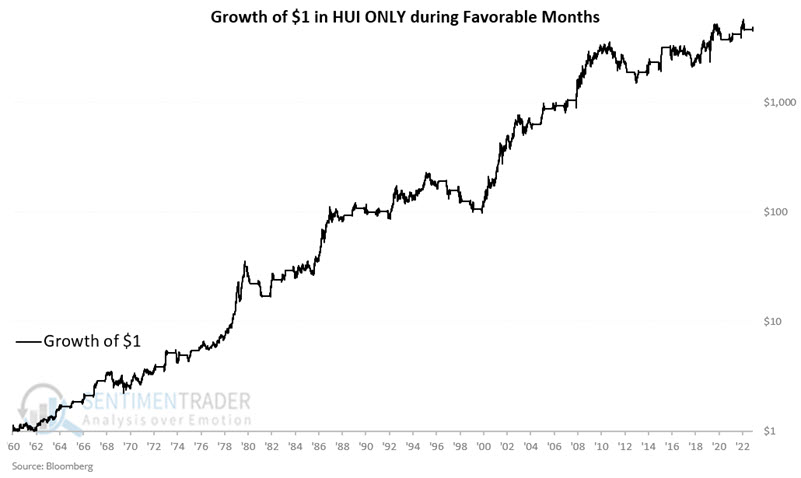
The chart below displays the same results as the chart above on a logarithmic scale.
The good news is that this Calendar generated a hypothetical gain of +466,023% in 73 years. The bad news is that the results are hypothetical, there is no guarantee that future results will look similar, and an investor following this method would have experienced significant drawdowns along the way.
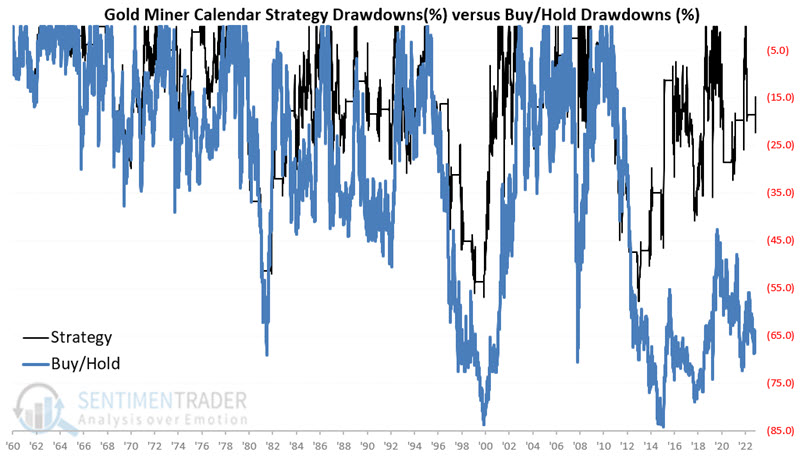
The chart below displays the drawdowns experienced if gold miners were held during all favorable months in the Gold Moner Calendar. Note that drawdowns exceeded -50 % on three separate occasions, with a maximum drawdown of -57.7%.
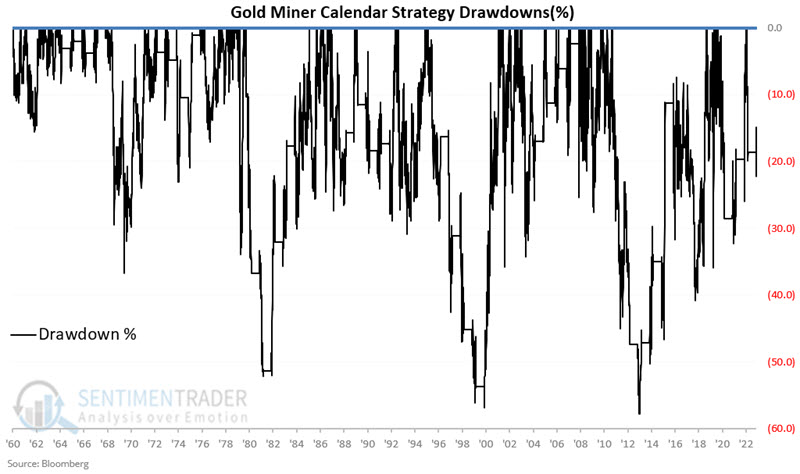
The only potential saving grace regarding drawdowns is that buy-and-hold experienced a maximum drawdown of a staggering -84.1%. The chart below displays drawdowns for the Gold Miner Calendar strategy versus for buy-and-hold.
Are these good reasons to be wary? Absolutely. But before dismissing the whole thing entirely, the chart below displays the hypothetical gain using the Gold Miner Calendar versus simply buying and holding ticker HUI.
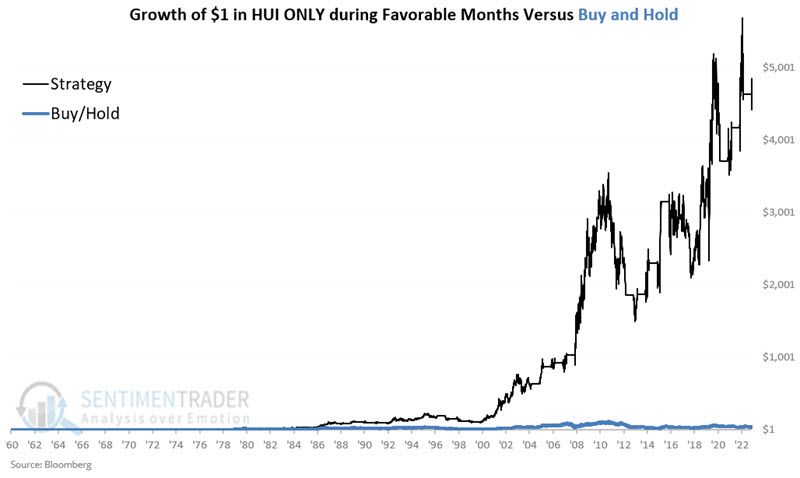
The strategy outperformed buy-and-hold by a factor of 117-to-1. So, there appears to be potential value. One real-world thought might be to allocate a relatively small portion of one's portfolio. A 50% drawdown on a 10% portfolio allocation is only -5% of the entire portfolio, which is likely manageable for most investors. A 50% drawdown on a 20% allocation is -10% of the whole portfolio, which might also be manageable, especially if the other 80% of the portfolio is making money elsewhere.
When NOT to invest
As mentioned a few times, the Gold Miners Calendar may be more useful not as a standalone trading model but simply as a tool to tell you when not to hold gold mining stocks. The chart below displays the growth of $1 in ticker HUI only during all months NOT labeled Miners in the Gold Miner Calendar starting in 1961.
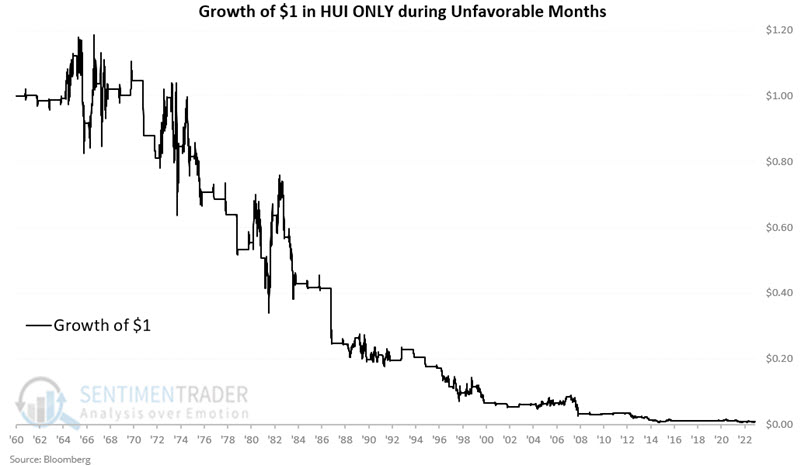
Yes, there have been some sharp advances along the way. But the bottom line is that the hypothetical return is -99.99% - which pretty much speaks for itself.
Comparing Calendar results to Buy and Hold
The best way to view Gold Miner Calendar results is to compare them to buy-and-hold results. The chart below displays the ratio of the growth of $1 using the Gold Miners Calendar divided by the growth of $1 using buy-and-hold.
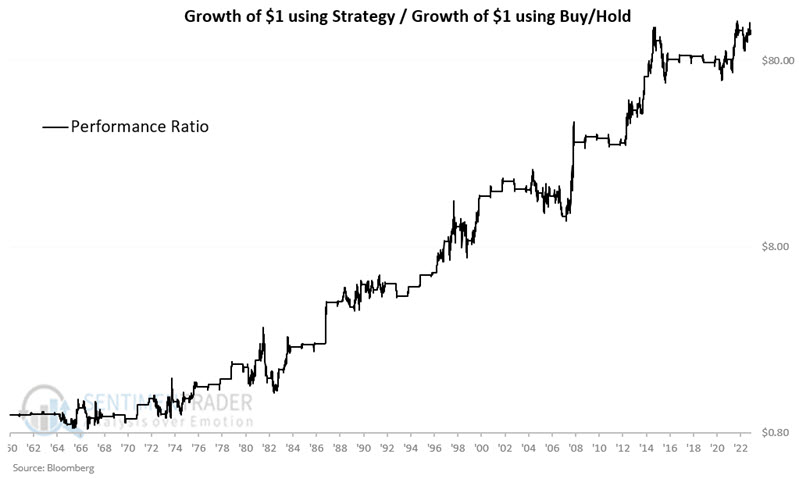
The "lower left to upper right" trend is unmistakable; however, it is no straight line. Remember also that the only time this ratio moves higher is when gold mining stocks are declining in price while the Gold Miner Calendar is in cash. Suppose we enter a period when gold mining stocks perform exceptionally well for several years. In that case, there is a danger of the Gold Miner Calendar underperforming buy-and-hold over a multi-year period.
The Gold Miner Calendar going forward
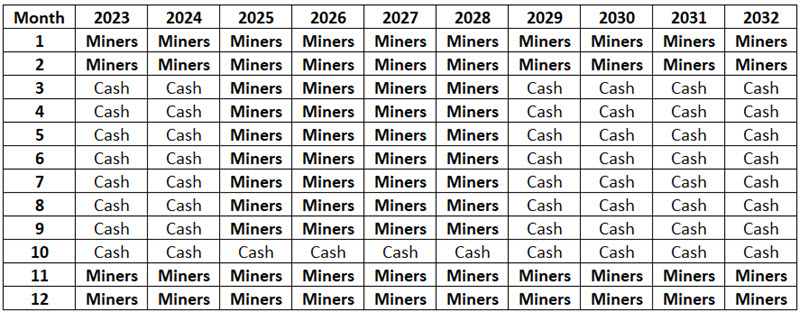
The table below displays the Gold Miner Calendar starting in 2023 and for the years ahead, including the entire next eight-year cycle that runs from the end of 2024 through the end of 2032.
What the research tells us…
The research tells us that gold mining stocks have displayed a relatively surprising degree of cyclicality of performance over the past 60+ years. It cannot tell us to what degree this tendency will persist in the future. Based on experience analyzing seasonal and cyclical trends for many years, it is probably safe to assume that the future performance will not match those detailed in this series. That does not mean that this was merely a mathematical exercise and that the Gold Miner Calendar will not continue to be of use. The main point is that each investor must make some decisions before using it with real money.
If one intends to follow the Calendar precisely as laid out, one must do two things:
- Allocate a reasonable - but not excessive - amount of capital (due to the volatility and drawdowns associated)
- Resolve to remain disciplined and follow the Calendar as closely as possible
The other approach is to use the Gold Miner Calendar as a "weight of the evidence" tool and to invest in gold miners only a) when the Calendar is favorable and b) other confirming indicators are in agreement with a bullish trend.