
The Gold Miner Calendar – Part I

Key points
- Gold mining stocks have shown a tendency to move in an 8-year wave: four favorable years followed by four unfavorable years
- There can be much variability - and extreme price volatility - in the results from cycle to cycle
- In Part I, we will look solely at the four-year favorable year performance versus the four-year unfavorable year performance
An overview of Gold Miner performance based on the calendar
We will use the Gold Bugs Index (ticker HUI), comprised of gold mining stocks. This index has data from 1957 that we can use for testing purposes. A brief overview of findings:
- The calendar we will present in Part II could be used as a standalone trading system; however, due to the highly volatile nature of gold mining stocks, it is not necessarily recommended
- It can be argued that the calendar we will present is more about when NOT to hold gold mining stocks than it is about WHEN TO hold them
- History suggests the existence of an underlying eight-year cycle in gold mining stock performance - four years are (mostly) "favorable," then the next four years are (mostly) "unfavorable"
- To make things interesting, there is one month in particular that has shown dreadful long-term results regardless of whether the year in question is rated as "favorable" or "unfavorable"
- There are four months during "unfavorable" years when gold miner performance is pretty good and eight months during "unfavorable" years when gold miner performance has been dreadful.
We will limit our examination to the underlying eight-year cycle for Part I. Let's get down to specifics and performance results.
Favorable Four-Year Periods
We will begin our test on 1960-12-31, which marks the start of a new eight-year cyclep.
- The first full "favorable" four-year period ran from 1961-01-01 through 1964-12-31. The first full "unfavorable" four-year period ran from 1965-01-01 through 1968-12-31
- The latest "unfavorable" period began on 2021-01-01 and will run through 2024-12-31
- The next "favorable" period will run from 2025-01-01 through 2028-12-31.
So Favorable periods include:
1961-1964
1969-1972
1977-1980
1985-1988
1993-1996
2001-2004
2009-2012
2017-2020
2025-2028
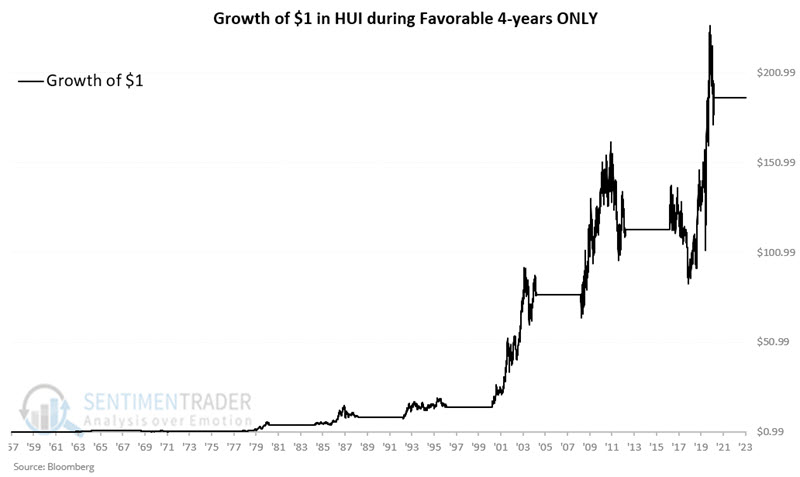
The chart below displays the hypothetical growth of $1 held in HUI only during all trading days of all months in favorable years.
The chart below displays the same information as above on a logarithmic scale.
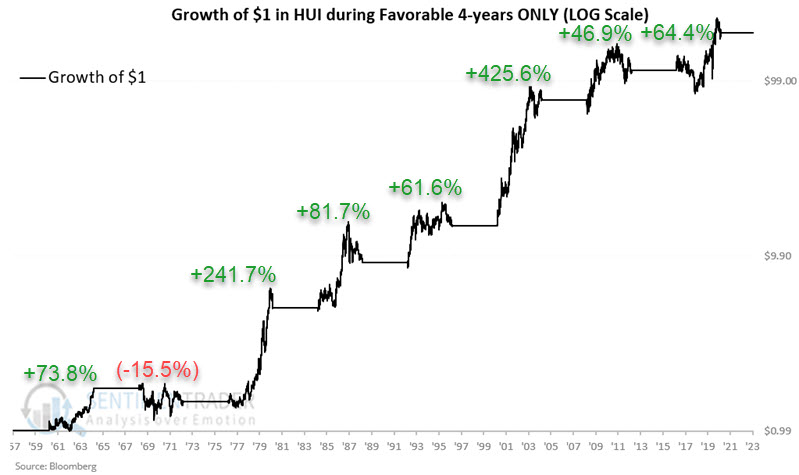
The good news during favorable years is twofold: First, ticker the net hypothetical gain for HUI during these periods is +18,606%. Second, seven of the eight (or 88%) completed favorable four-year periods witnessed a gain. The bad news is that there is tremendous price volatility even among these favorable periods, which could sorely test the resolve of buy-and-hold investors.
Unfavorable Four-Year Periods
The first "unfavorable" four-year period examined in our test ran from 1965-01-01 through 1968-12-31. The latest "unfavorable" period began on 2021-01-01 and will run through 2024-12-31
So Unfavorable periods include:
1965-1968
1973-1976
1981-1984
1989-1992
1997-2000
2005-2008
2013-2016
2021-2024
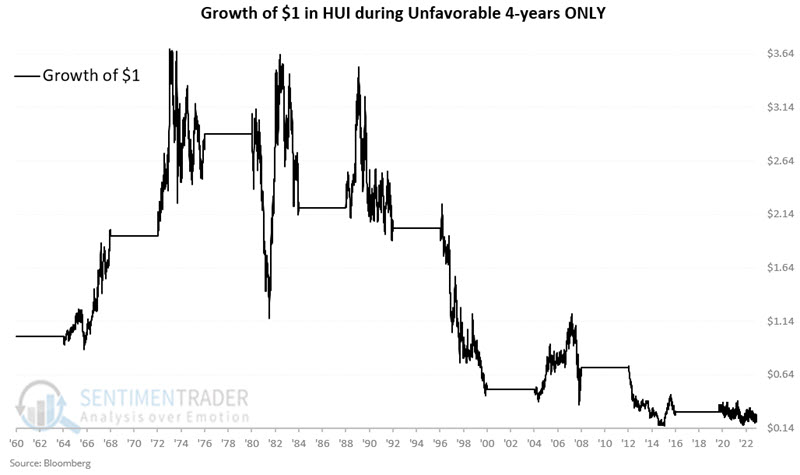
The chart below displays the hypothetical growth of $1 held in HUI only during all trading days of all months in unfavorable years.
The chart below displays the same information as above on a logarithmic scale.
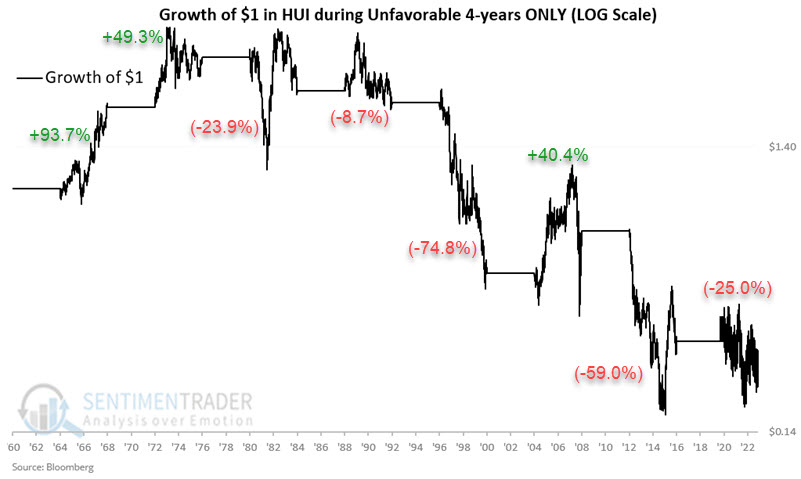
During unfavorable years, ticker HUI lost -73.8%. Notably, three of the eight (or 38%) of the so-called "unfavorable" periods witnessed a net gain for ticker HUI. And even some periods that ultimately showed a loss saw significant rallies along the way. So, any trader thinking about selling short gold miners and simply waiting around for four years to collect their profit may wish to reconsider the wisdom of that approach.
For the record, the latest unfavorable that started on 2021-01-01 has seen HUI decline -25%.
Summarizing Initial Results
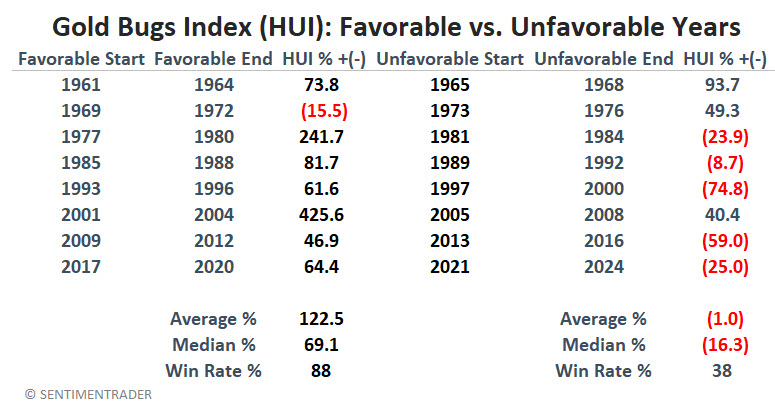
The table below shows cycle-by-cycle results and a performance summary for Favorable four-year periods versus Unfavorable four-year periods.
What the research tells us…
As with everything in the financial markets, there are no sure things. The data above clearly shows that gold miners have performed much better during favorable and unfavorable years. But along the way, one favorable period showed a net loss, three unfavorable periods showed a net gain and a lot of volatility was experienced regardless of position or cyclical slant. In Part II, we will look at a few refinements that might improve the overall usefulness of the cyclical nature of gold miners.